Site Assessment

Jun 11 2024
- Survey
- Site Assessment
สรุปข้อมูลสำคัญนี้มีจุดมุ่งหมายเพื่อนำเสนอภาพรวมของสภาวการณ์ ความต้องการ และความท้าทายตามประเด็นหัวข้อต่าง ๆ ในหมู่ผู้ย้ายถิ่นชาวเมียนมาในจังหวัดภูเก็ตที่ไอโอเอ็ม ประเทศไทยได้ดำเนินการประเมินความต้องการหลายภาคส่วนระหว่างเดือนพฤษภาคม ถึงเดือนมิถุนายน พ.ศ. 2567 เพื่อให้ข้อมูลเชิงลึกเกี่ยวกับระดับความรุนแรงของความต้องการของประชากรผู้ย้ายถิ่น ระบุกลุ่มประชากรที่เปราะบางและพื้นที่ทางภูมิศาสตร์ซึ่งมีความต้องการระดับสูงสุด รวมทั้งนำเสนอข้อมูลเพื่อการวางแผนให้ความช่วยเหลือและเป้าหมายย่อยของเป้าหมายการพัฒนาที่ยั่งยืน (SDGs) ที่เกี่ยวข้อง และเป็นเส้นฐานรายภาคส่วนและระหว่างภาคส่วนสำหรับการประเมินต่าง ๆ ในอนาคต
- Mobility Tracking
- Site Assessment
Mar 16 2024
In Round 47, a total of 2,271,987 Internally Displaced Persons (IDPs) were identified in 468,013 households. This signifies a slight decrease of one per cent (or 33,348 individuals) compared to Round 46 when 2,305,335 IDPs were recorded (December 2023). During Round 47, IDP assessments were conducted in 2,299 locations across the six states of north-east Nigeria. The assessed locations included 266 camps and camp-like settlements and 2,033 locations where internally displaced persons lived among host communities. Furthermore, 2,093,604 returnees were recorded in Borno, Adamawa and Yobe (BAY) states during the Round 47 assessment. This number represents an increase of 9,769 individuals or less than one per cent compared to Round 46 when 2,083,835 returnees were recorded in December 2023.
Population Groups
IDPs
Returnee (Previously Internally Displaced)
Survey Methodology
Unit of Analysis Or Observation
Admin Area 2
Site
Type of Survey or Assessment
Key Informant
Keywords
Geographical Scope Partial Coverage
Administrative boundaries with available data
The current dataset covers the following administrative boundaries

Mar 15 2024
- Survey
- Site Assessment
สรุปข้อมูลสำคัญนี้มีจุดมุ่งหมายเพื่อนำเสนอภาพรวมของสภาวการณ์ ความต้องการ และความท้าทายตามประเด็นหัวข้อต่าง ๆ ในหมู่ผู้ย้ายถิ่นชาวเมียนมาในจังหวัดกาญจนบุรีที่ไอโอเอ็ม ประเทศไทยได้ดำเนินการประเมินความต้องการหลายภาคส่วนระหว่างเดือนธันวาคม พ.ศ. 2566 ถึงเดือนมีนาคม พ.ศ. 2567 เพื่อให้ข้อมูลเชิงลึกเกี่ยวกับระดับความรุนแรงของความต้องการของประชากรผู้ย้ายถิ่น ระบุกลุ่มประชากรที่เปราะบางและพื้นที่ทางภูมิศาสตร์ซึ่งมีความต้องการระดับสูงสุด รวมทั้งนำเสนอข้อมูลเพื่อการวางแผนให้ความช่วยเหลือและเป้าหมายย่อยของเป้าหมายการพัฒนาที่ยั่งยืน (SDGs) ที่เกี่ยวข้อง และเป็นเส้นฐานรายภาคส่วนและระหว่างภาคส่วนสำหรับการประเมินต่าง ๆ ในอนาคต

Oct 28 2024
- Registration
- Flow Monitoring
- Mobility Tracking
- Site Assessment
As of the end of October 2024, 137,389 individuals (31,019 households) are biometrically registered as active residents in the camp, representing a two per cent increase in registered individuals since January 2024 following the latest biometric registration maintenance in Bentiu IDP Camp.

Jun 05 2024
- Mobility Tracking
- Site Assessment
The Round 14 MSLA assessed 103 sites across Northern Mozambique, identifying a total of 214,576 internally displaced persons (IDPs). This represents a nine per cent increase from the previous round, with displacement driven primarily by ongoing insecurity in Cabo Delgado. While these figures focus on those residing in designated sites, it is important to note that many displaced individuals are also living within host communities, as reported in the DTM Round 21 Mobility Tracking Report. The assessment covered a range of site types, including relocation sites, resettlement sites, temporary sites or transit centers, and host community extensions. The findings provide a comprehensive overview of the demographic breakdown of IDPs, their vulnerabilities, and the specific sectoral needs across shelter, water, sanitation and hygiene (WASH), food security, health, education, protection, and community engagement.
Key findings reveal that 55 per cent of the IDP population are children (under 18), with significant challenges in shelter, food security, and access to essential services. The data underscores the importance of targeted humanitarian interventions to address the ongoing and dynamic displacement situation in Northern Mozambique.

Jun 05 2024
- Mobility Tracking
- Site Assessment
The Round 14 MSLA assessed 93 sites across Central and Southern Mozambique, identifying a total of 136,637 IDPs. This represents a 14 per cent increase from the previous round, with displacement driven primarily by climatic shocks. While these Figure focus on those residing in designated sites, it is important to note that many displaced individuals are also living within host communities, as reported in the DTM Round 21 Mobility Tracking Report. The assessment covered a range of site types, including relocation sites, resettlement sites, temporary sites or transit centers, and host community extensions. The findings provide a comprehensive overview of the demographic breakdown of IDPs, their vulnerabilities, and the specific sectoral needs across shelter, water, sanitation and hygiene (WASH), food security, health, education, protection, and community engagement.
Key findings reveal that 50 per cent of the IDP population are children (under 18), with significant challenges in shelter, food security, and access to essential services. The data underscores the importance of targeted humanitarian interventions to address the ongoing and dynamic displacement situation in Central and Southern Mozambique.

Nov 29 2023
- Survey
- Site Assessment
บทสรุป: สรุปข้อมูลสำคัญนี้มีจุดมุ่งหมายเพื่อนำเสนอภาพรวมของสภาวการณ์ ความต้องการ และความท้าทายตามประเด็นหัวข้อต่าง ๆ ในหมู่ผู้ย้ายถิ่นชาวเมียนมาในจังหวัดระนองที่ไอโอเอ็ม ประเทศไทยได้ดำเนินการประเมินความต้องการหลายภาคส่วนระหว่างเดือนกันยายนถึงพฤศจิกายน พ.ศ. 2566 เพื่อให้ข้อมูลเชิงลึกเกี่ยวกับระดับความรุนแรงของความต้องการของประชากรผู้ย้ายถิ่น ระบุกลุ่มประชากรที่เปราะบางและพื้นที่ทางภูมิศาสตร์ซึ่งมีความต้องการระดับสูงสุด รวมทั้งนำเสนอข้อมูลเพื่อการวางแผนให้ความช่วยเหลือและเป้าหมายย่อยของเป้าหมายการพัฒนาที่ยั่งยืน (SDGs) ที่เกี่ยวข้อง และเป็นเส้นฐานรายภาคส่วนและระหว่างภาคส่วนสำหรับการประเมินต่าง ๆ ในอนาคต
Aug 16 2024
- Survey
- Site Assessment
This factsheet aims to provide a snapshot of multi-sectoral conditions, needs, and challenges among Myanmar migrants in Phetchabun as captured in August 2024 by IOM Thailand’s multi-sectoral assessment of needs. The purpose of this assessment is to provide insights regarding the severity of needs among migrant populations, identify vulnerable population groups and geographic areas with the most acute needs, inform assistance planning and relevant Sustainable Development Goals (SDGs) targets, and provide sectoral and inter-sectoral baselines for future assessments.
Dec 31 2023
- Mobility Tracking
- Site Assessment
- Village Assessment
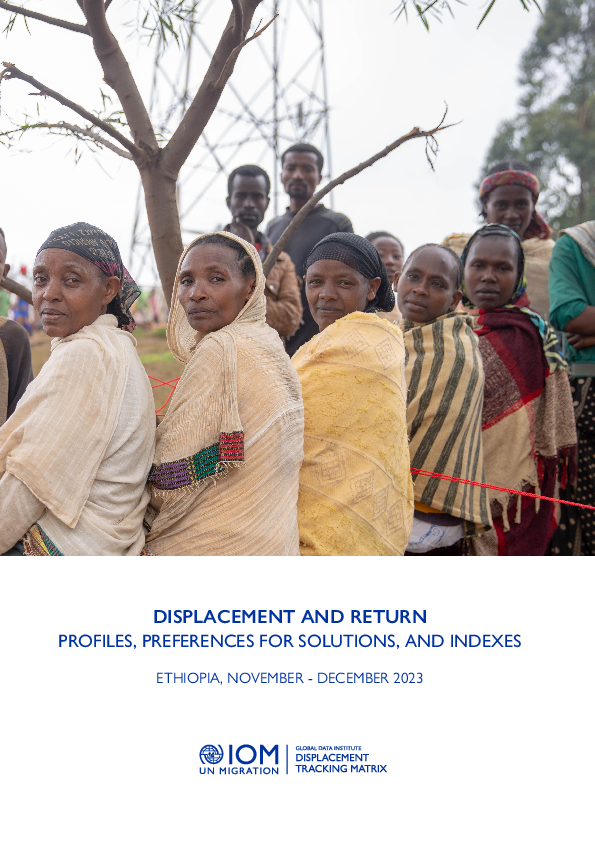
Household level data collected through the DTM Site Assessment (SA) is a powerful tool to better understand how IDPs' preferences towards durable solutions are impacted by the regional context, as well as reasons for displacement, and how long displaced households have been in their current location of displacement. For instance, while most IDPs displaced due to conflict in Somali region see local integration as their preferred durable solutions pathway, most conflict-IDPs in Tigray region have a preference for return.
In addition, household level data gathered though the DTM Site Assessment (SA) and Village Assessment Survey (VAS) can help define profiles of displaced and returned populations, and can also be compiled into an index to measure, monitor and compare the living conditions and socio-economic situation of IDPs and returning IDPs across the assessed locations. The indexes also allow for the prioritization of locations to support needs-based interventions.

Sep 04 2024
- Mobility Tracking
- Baseline Assessment
- Site Assessment
- Village Assessment
Round 8, which took place from August 1 to September 4, 2024, indicates the presence of 702,973 internally displaced persons in Haiti, almost 22% more than in Round 7.
The armed attacks in the municipality of Gressier (located in the West department, outside the MAPAP) are the main reason for this increase; this municipality has been almost emptied of its population following these attacks and has become the second municipality of origin of IDPs in the country whereas it was in 5th position during Round 7.
A slight decrease (6%) in the number of IDPs was observed in the MAPAP, reflecting the continuation of displacement from the capital to provinces but in smaller proportions compared to the period of March-April 2024. Returns of some IDPs that was also observed, in particular in certain neighborhoods of the municipality of Cité Soleil (see the section on returnees).
The MAPAP currently hosts a quarter of the country's IDPs, compared to nearly a third in Round 7 (25% in Round 8 vs 32% in Round 7).
Provinces thus host 75% of the country's IDPs. In particular, the Great South (departments of South, Grande'Anse, South-East and Nippes) which host almost half of IDPs: 45% of the country's IDPs are hosted in these 4 departments.
The West Department, particularly the MAPAP, is the provenance of the vast majority of IDPs in all departments. The only exception is Artibonite, where 56% of IDPs fled from areas within the same department..
At the national level, the majority of IDPs are hosted in host families/out of sites: 83% (vs 17% in sites). However, in the MAPAP the majority of IDPs reside in sites (63% in sites vs. 37% in host families/out of sites), while in provinces the opposite is true (98% in host families/out of sites vs. 2% in sites).
, 65,535 returnees formerly IDPs were identified, particularly in the commune of Cité Soleil where a 151% increase in the number of returnees was observed. It should be noted that for the moment these returns remain very fragile and are not sustainable, particularly in the MAPAP. Indeed, returnees are often displaced again following new attacks in their return area: in the MAPAP, 52% of IDPs have already been displaced more than once and these multiple movements include new ones after returning home

DTM Global Survey 2023
The Displacement Tracking Matrix (DTM) Global Survey 2023 is an annual stocktaking exercise which aims to present IOM DTM's operations and activities transparently. The Global Survey focuses on operations active from January 1 to December 31, 2023, with data collection occurring from February to April 2024.