-
Countries
-
Data and Analysis
-
Special Focus
-
Crisis Responses

Contact
DTM Europe, DTMMediterranean@iom.int
Language
English
Location
Republic of Moldova
Period Covered
Apr 01 2023
Jun 30 2023
Activity
- Survey
- Flow Monitoring
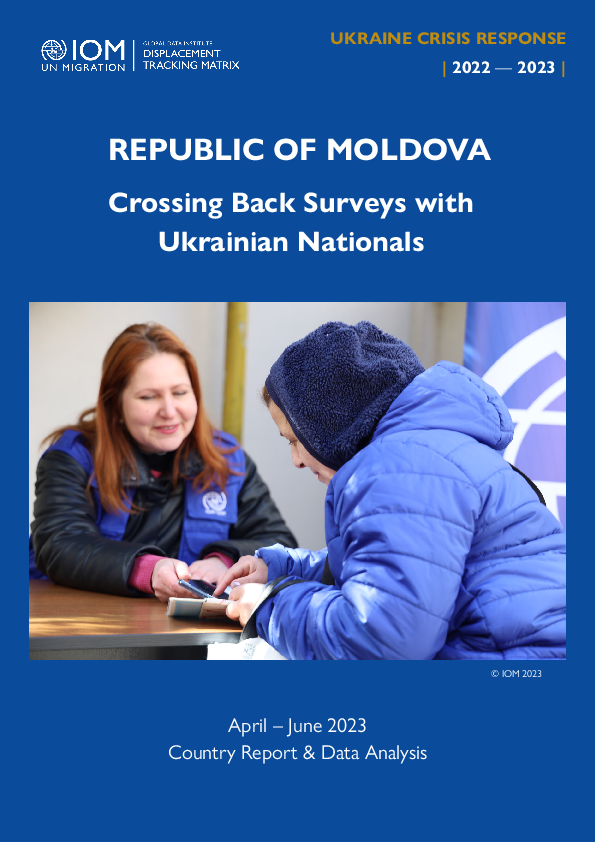
This report is based on a survey of displacement patterns, needs and intentions conducted by IOM’s Displacement Tracking Matrix (DTM) in the 11 countries included in the Regional Response Plan for Ukraine in 2023: 6 countries neighbouring Ukraine – Belarus, Hungary, Poland, Republic of Moldova, Romania and Slovakia – and other 5 countries particularly impacted by the arrivals of refugees from Ukraine since the start of the war in February 2022 – Bulgaria, Czechia, Estonia, Latvia and Lithuania. The analysis presented in this report is based on data collected between April and June 2023.
Key Findings
• Top oblasts of origin: Odeska (28%), Vinnytska (20%), City of Kyiv (9%), Mykolaivska (7%), Zaporizka (5%), Kyivska (5%), Dnipropetrovska (3%), Kharkivska (3%).
• Intentions to move: settled or planning to settle in the Republic of Moldova (49%), transiting to another country (45%) - mainly to Romania, Germany and Canada. Move back to place of origin in Ukraine (4%).
• Employment status: employed (21%), daily workers (11%), unemployed and looking for a job (11%), student (1%), maternity leave (10%).
• Top needs*: financial support (25%), food products (12%), personal hygiene items (11%), accommodation (8%), medicines (6%).
• Top areas of assistance received*: food supplies (24%), personal hygiene items (21%), financial support (19%), accommodation (7%), vouchers (6%). • Main inclusion challenges*: financial issues (34%), housing (long-term) (16%).
• Transport: walking (28%), mini bus (26%), car (23%), and bus (12%).
* More than one answer possible

Contact
DTM Europe, DTMMediterranean@iom.int
Language
English
Location
Republic of Moldova
Period Covered
Apr 01 2023
Jun 30 2023
Activity
- Survey
- Return Intention
Since 24 February 2022, refugees from Ukraine and Third Country Nationals (TCNs) have been fleeing to neighbouring countries as a result of the war. As of May 2023, more than eight million refugees from Ukraine were recorded across Europe. At the same time, almost 13 million of border crossings of border crossings of Ukrainian and Third-Country refugees and migrants were reported from Ukraine into the neighbouring countries since February 2022.
IOM has deployed its Displacement Tracking Matrix (DTM) tools since mid-April 2022 to collect individual surveys in neighbouring countries with persons crossing into Ukraine, with the aim to improve the understanding of main profiles, displacement patterns, intentions and needs of those moving into Ukraine. This report is based on surveys collected in the Republic of Moldova between 01 April 2023 and 30 June 2023 in two border crossing points, Otaci and Palanca.
Key Findings
• Top 3 countries of stay abroad: Romania (21%), Türkiye (11%), Germany (9%). • Top oblasts of origin: Odeska oblast (43%), Kyiv city and Kyivska (18%), Mykolaivska oblast (13%).
• Intended destinations: going to same oblast of origin (91%), to a different oblast (8%) - mainly to Vinnytska, Odeska & Kyiv city.
• Transport to Ukraine: car (57%), bus (31%), foot (10%).
• Intentions upon crossing back: long-term stay (58%), short-term visit (38%).
• Top needs upon crossing back:* financial support (20%), medicines and health services (6%), food products (9%), employment (8%). Other specified needs (12%) while 28% had no immediate needs.
• Top areas of assistance received:* food products and meals (27%), financial support (26%), NFI/hygiene items (22%), vouchers (2%), accommodation (8%).
* More than one answer possible
Contact
DTM Sudan, DTMSudan@iom.int
Location
Sudan
Activity
- Mobility Tracking
- Baseline Assessment
Period Covered
Jan 01 2023 -Mar 31 2023
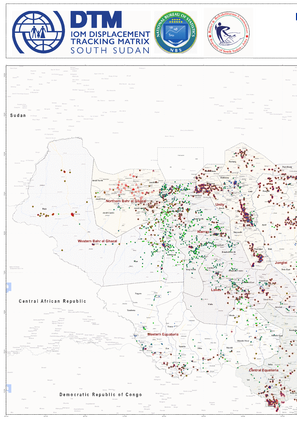
DTM identified a total accumulative number of 3,820,772 IDP individuals (763,889 households) in 1,053 locations in 138 localities in 17 states across Sudan. The greatest proportion of displacement (83%) in the country is protracted (ongoing for more than five years, see Diagram 1). An estimated 2,057,846 current IDPs (54%) were initially displaced between 2003 and
2010 at the height of the Darfur crisis. In comparison, 1,081,169 IDPs (28%) observed were initially displaced
between 2011 and 2017, in addition to 40,629 (1%) newly displaced in 2018; 53,288 IDPs (1%) in 2019; 112,742 IDPs (3%) in 2020; 210,274 (6%) in 2021; and 264,824 individuals (7%) observed in 2022.
Population Groups
Survey Methodology
Unit of Analysis Or Observation
Type of Survey or Assessment
Keywords
Geographical Scope
Administrative boundaries with available data
The current dataset covers the following administrative boundaries
Contact
DTM Sudan, DTMSudan@iom.int
Location
Sudan
Activity
- Mobility Tracking
- Baseline Assessment
Period Covered
Jan 01 2023 -Mar 31 2023
DTM estimates a total number of 1,302,938 permanent returnees from internal displacement (193,388 households) in 773 locations, in 71 localities, in 11 states across Sudan. Reporting on returns in a chronological manner, the data indicates that between 2003 and 2010, 168138 returnees (13%) returned to their location of origin. The highest proportion of returns (265,589) occurred between 2011 to 2015 (20% of the total count) – reflective of a mass influx of individuals returning to their habitual residences at the end of the Darfur crisis. This was followed by 137,383 returnees (11%) in 2016, 195,637 returnees (15%) in 2017, and 159,648 returnees (12%) in 2018. The lowest proportion of returnees returned in 2019
(64,592) and 2020 (57,097), representing 5% and 4.4% respectively. Finally, in 2021 and in 2022, field teams identified 71,905 (6%) and 182,949 (14%) permanent returnees respectively.
Population Groups
Survey Methodology
Unit of Analysis Or Observation
Type of Survey or Assessment
Keywords
Geographical Scope
Administrative boundaries with available data
The current dataset covers the following administrative boundaries
Contact
DTM Sudan, DTMSudan@iom.int
Location
Sudan
Activity
- Mobility Tracking
- Baseline Assessment
Period Covered
Jan 01 2023 -Mar 31 2023
DTM estimates a total accumulative number of 32,221 seasonal returnees (6,609 households) within 79 locations, in 35
localities across 10 states. In Round Six, DTM teams observed populations who returned to their habitual residence on an
impermanent basis – due to seasonal changes and cultivation, harvesting and livestock purposes. These population figures
are expected to remain influx and observe drastic changes over the course of each year, as people continue to move
with the seasons. As of first quarter 2023, East Darfur hosts over a third (34%) of all seasonal returnees in Sudan. North
Darfur hosts the second largest proportion (18%) of seasonal returnees, followed by South Darfur (14%), Blue Nile (13%),
Red Sea (6%), West Darfur (6%), West Kordofan (4%), South Kordofan (2%), White Nile (2%), and Central Darfur (1%).
Population Groups
Survey Methodology
Unit of Analysis Or Observation
Type of Survey or Assessment
Keywords
Geographical Scope
Administrative boundaries with available data
The current dataset covers the following administrative boundaries
Contact
DTM Sudan, DTMSudan@iom.int
Location
Sudan
Activity
- Mobility Tracking
- Baseline Assessment
Period Covered
Jan 01 2023 -Mar 31 2023
DTM estimates a total accumulative number of 309,724 returnees from abroad (59,003 households) among 335 locations in 31 localities from across 11 states in Sudan. The increase in number of returnees from abroad observed since Round Five is reflective of the expansion of field team operations to additional states, as well as field teams visiting additional locations within previous states of operation. Reporting in a chronological manner, approximately 58,232 returnees from abroad (19% of the total caseload) reportedly returned to their locations of origin between 2003 and 2010. The highest proportion
of returnees from abroad (123,091) reported that they returned between 2011 and 2015 (40%), followed by 14,677 returnees in 2016 (5%), 8,465 returnees in 2017 (3%), 12,445 in 2018 (4%), 6,901 returnees in 2019 (2%), 6,901 in 2020 (2%), 3,128 in 2021 (1%), and 75,971returnees in 2022 (24%).
Population Groups
Survey Methodology
Unit of Analysis Or Observation
Type of Survey or Assessment
Keywords
Geographical Scope
Administrative boundaries with available data
The current dataset covers the following administrative boundaries
Contact
DTM Sudan, DTMSudan@iom.int
Location
Sudan
Activity
- Mobility Tracking
- Baseline Assessment
Period Covered
Jan 01 2023 -Mar 31 2023
IOM estimates a total cumulative number of 1,688,083 of foreign nationals across Sudan. Included in this figures are
1,129,090 refugees and asylum seekers as estimated by UNHCR and the Commission for Refugees, and 558,993
foreign nationals as identified by DTM field teams during data collection operations.5 This figure of foreign nationals is
an assessment of population presence in targeted locations and is not meant as quotable figure for the whole of Sudan.
Following data collection for Mobility Tracking Round Six, DTM field teams estimated that a total accumulative number
of 558,993 foreign nationals (120,941 households) were located across in 708 locations, in 122 localities, across 17
states in Sudan.6 Overall, the majority of foreign nationals (including both DTM’s and UNHCR’s estimate) identifies
South Sudanese as the largest population (73.5% of the total count). This is followed by Eritrean (10.0%), Ethiopian (7.1%),
Syrian (5.5%), Central African (2.8%), Chadian (0.6%), and Yemeni (0.1%) – with other nationalities making up 0.4%
of the population. Looking specifically at DTM field teams, the majority of foreign nationals identified by were South
Sudanese nationals (79.5%), followed by Ethiopian (8.7%), Eritrean (6%), Central African Republic (4%), and Chadian
(1%), among other nationalities (<1%).
Population Groups
Survey Methodology
Unit of Analysis Or Observation
Type of Survey or Assessment
Keywords
Geographical Scope
Administrative boundaries with available data
The current dataset covers the following administrative boundaries

Contact
DTM Yemen, iomyemendtm@iom.int
Language
English
Location
Yemen
Period Covered
Sep 10 2023
Sep 16 2023
Activity
- Rapid Emergency Registration
- Mobility Tracking
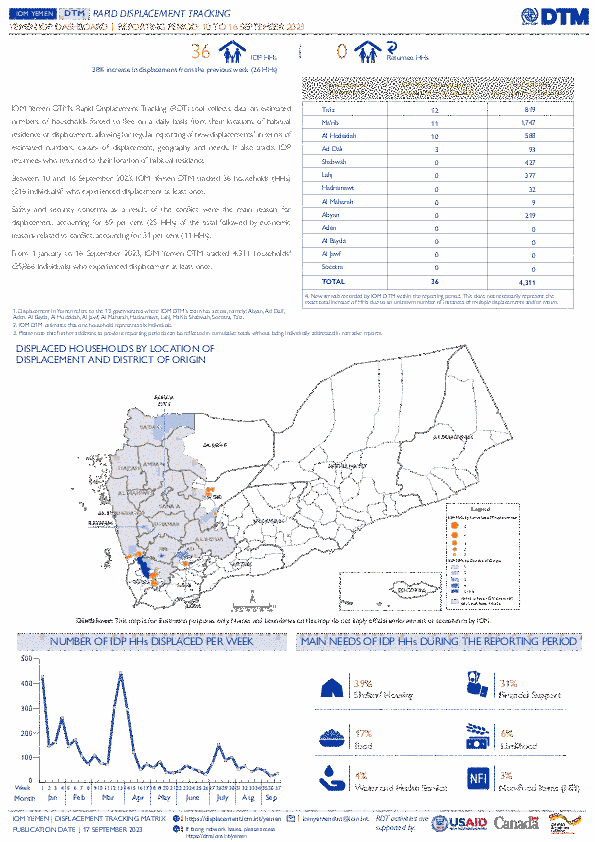
IOM Yemen DTM’s Rapid Displacement Tracking (RDT) tool collects data on estimated numbers of households forced to flee on a daily basis from their locations of origin or displacement, allowing for regular reporting of new displacements in terms of estimated numbers, geography, and needs. It also tracks returnees who returned to their location of origin.
From 1 January to 16 September 2023, IOM Yemen DTM tracked 4,311 households (HH) (25,866 Individuals) who experienced displacement at least once.
Between 10 and 16 September 2023, IOM Yemen DTM tracked 36 households (216 individuals) displaced at least once. The majority of people moved into/within the following governorates and districts:
- Ta’iz (12 HHs) – Jabal Habashi (5 HHs), Ash Shamayatayn (5 HHs), Al Misrakh (1 HH) districts. Most displacements in the governorate originated from Ta’iz and Ibb.
- Ma’rib (11 HHs) – Ma’rib (5 HHs), Ma’rib City (3 HHs), Harib (3 HHs) districts. Most displacements in the governorate originated from Sadah and Dhamar.
- Al Hodeidah (10 HHs) – Hays (7 HHs), Al Khukhah (3 HHs) districts. Most displacements in the governorate originated from Ta’iz and Al Hodeidah.
The majority of people moved from the following governorates and districts:
- Ta’iz (13 HHs) – Maqbanah (10 HHs), Sharab Ar Rawnah (2 HHs), As Silw (1 HH) districts.
- Al Hodeidah (5 HHs) – Al Jarrahi (2 HHs), Hays (2 HHs), Al Hali (1 HH) districts.
- Ibb (4 HHs) – Jiblah (4 HHs) district.
Contact
DTM Yemen, iomyemendtm@iom.int
Location
Yemen
Activity
- Mobility Tracking
Period Covered
Sep 10 2023 -Sep 16 2023
From 1 January to 16 September 2023, IOM Yemen DTM tracked 4,311 households (HH) (25,866 Individuals) who experienced displacement at least once.
Between 10 and 16 September 2023, IOM Yemen DTM tracked 36 households (216 individuals) displaced at least once. The majority of people moved into/within the following governorates and districts:
- Ta’iz (12 HHs) – Jabal Habashi (5 HHs), Ash Shamayatayn (5 HHs), Al Misrakh (1 HH) districts. Most displacements in the governorate originated from Ta’iz and Ibb.
- Ma’rib (11 HHs) – Ma’rib (5 HHs), Ma’rib City (3 HHs), Harib (3 HHs) districts. Most displacements in the governorate originated from Sadah and Dhamar.
- Al Hodeidah (10 HHs) – Hays (7 HHs), Al Khukhah (3 HHs) districts. Most displacements in the governorate originated from Ta’iz and Al Hodeidah.
- Ta’iz (13 HHs) – Maqbanah (10 HHs), Sharab Ar Rawnah (2 HHs), As Silw (1 HH) districts.
- Al Hodeidah (5 HHs) – Al Jarrahi (2 HHs), Hays (2 HHs), Al Hali (1 HH) districts.
- Ibb (4 HHs) – Jiblah (4 HHs) district.
Population Groups
Survey Methodology
Unit of Analysis Or Observation
Type of Survey or Assessment
Keywords
Geographical Scope
Administrative boundaries with available data
The current dataset covers the following administrative boundaries

