Thematic Map
Focuses on a particular subject area
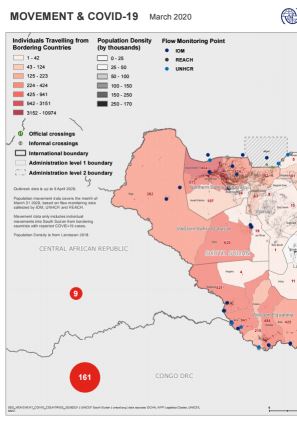
IOM DTM, UNHCR and REACH combined their flow monitoring data for South Sudan with geographically disaggregated data about COVID-19 cases in neighbouring countries compiled by UNICEF, with the aim of mapping population inflows at risk of COVID-19 transmission. The analysis is indicative of incoming movements 73 flow monitoring points at South Sudan’s borders and internal transport hubs, of which 65 recorded incoming cross-border travel in March 2020. This map shows overall inflows from neighbouring countries in March 2020.
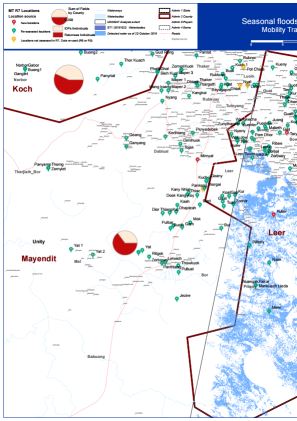
The map displays displacement locations, their data source and flooding in Leer County, Unity State as of November 2019.
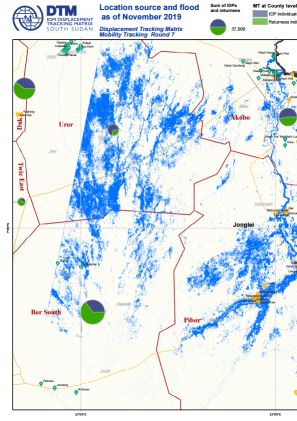
The map displays displacement locations, their data source and flooding as of November 2019.
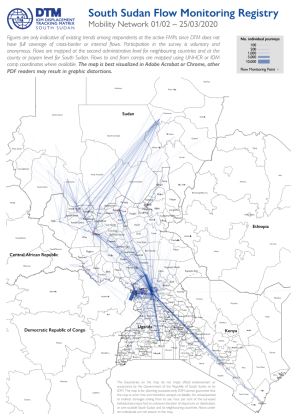
This map shows the human mobility network tracked by DTM's Flow Monitoring Registry in South Sudan and between South Sudan and neighbouring countries, based on interviews carried out at 39 Flow Monitoring Points between 01/02/2020 and 25/03/2020. Figures are only indicative of existing trends among respondents at the active FMPs since DTM does not have full coverage of cross-border or internal flows. Participation in the survey is voluntary and anonymous.
Flows are mapped at the second administrative level for neighbouring countries and at the county or payam level for South Sudan. Flows to and from camps are mapped using UNHCR or IOM camp coordinates where available.
The map is best visualized in Adobe Acrobat or Chrome, other PDF readers may result in graphic distortions.

This maps displays the shelter status of returnees thrughout South Sudan based on Mobility Tracking data round 7 (Nov 2019).
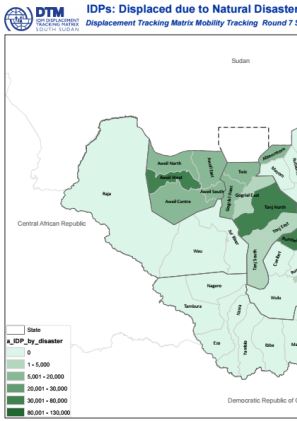
Mobility Tracking round 7: displacement due to natural disasters for IDP arrivals between 2014 and 2019.
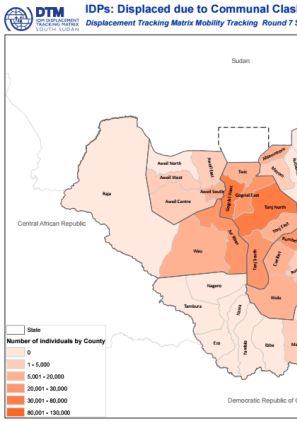
Mobility Tracking round 7: displacement due to communal clashes for IDP arrivals between 2014 and 2019.
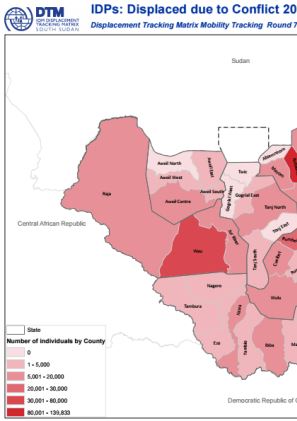
Mobility Tracking round 7: displacement due to conflict (involving national actors) for IDP arrivals between 2014 and 2019.

Este mapa muestra la población en Centros de Cumplimento de Cuarentena (CCC).

Este mapa es para poblacion en Centros de Cumplimientos de Cuarentena (CCC) para de semana 15 de Marzo 2020.

DTM API
Making global IDPs data accessible and reliable
The Displacement Tracking Matrix application programming interface (API) accelerates secure sharing of IDPs’ data, simplifying access to data across users and partners to support action, insight and foresight.