Site Assessment
- Mobility Tracking
- Site Assessment
Jun 08 2024
This dataset presents the results of evaluations conducted between May 7 and June 8, 2024, in 293 displacement locations. Comparing Round 23 with Round 22 in terms of the total displaced population, we observe a slight increase of 0.2%, which is insignificant as it represents fewer than 500 people. This is explained by the fact that, although some sites are abandoned due to lack of assistance and preventive displacements in some cases, some people from abandoned sites continue to move to existing sites. For example, those who left the Koulkime 3 site (Baga-Sola) moved to the Kollom site (Bol). Additionally, attacks on the islands have led to the creation of new displacement sites such as Tchoukou-Kebi. The displacement situation in the Lac Province remains volatile, with the creation of new spontaneous displacement sites and the abandonment of some existing sites. This data collection was carried out in partnership with the National Commission for the Reception and Reintegration of Refugees and Returnees (CNARR), the governorate of the Lake Province, the provincial delegation of the Ministry of Economy, Planning, and International Cooperation (MEPCI), and the Red Cross of Chad (CRT). The data were triangulated by the DTM, and humanitarian actors were involved in the development of cluster-specific indicators and in-depth data analysis.
Population Groups
IDPs
Returnee (Previously Displaced Abroad)
Returnee (Previously Internally Displaced)
Survey Methodology
Unit of Analysis Or Observation
Admin Area 4
Community
Type of Survey or Assessment
Key Informant
Keywords
Geographical Scope Partial Coverage
Administrative boundaries with available data
The current dataset covers the following administrative boundaries

Returnee comparison at the Location level. Change in the number of returnees compared to Round 46.

Returnee comparison at the Local Government Area (LGA) level. Change in the number of returnees compared to Round 46.

Period of arrival of returnees who arrived from abroad.

Period of arrival of returnees who arrived from within Nigeria.

Returnees by LGA.
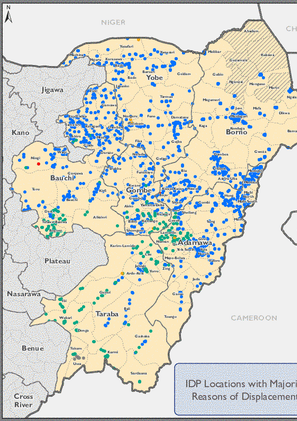
IDP reasons for displacement

IDP comparison at the location. Change in the number of IDPs compared to Round 46.

IDP comparison at the Local Government Area (LGA) level. Change in the number of IDPs compared to Round 46.

IDPs — Reasons for displacement (Farmers-Herders clashes/Armed banditry)

DTM Global Survey 2023
The Displacement Tracking Matrix (DTM) Global Survey 2023 is an annual stocktaking exercise which aims to present IOM DTM's operations and activities transparently. The Global Survey focuses on operations active from January 1 to December 31, 2023, with data collection occurring from February to April 2024.