Reports
Displaying 1 - 20 of 66
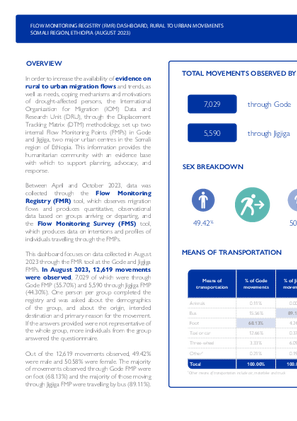
Ethiopia — Rural to Urban Movements in Somali Region, Internal Flow Monitoring Dashboard (August 2023)
… RURAL TO URBAN MOVEMENTS SOMALI REGION, ETHIOPIA (AUGUST 2023) In order to increase the … major urban centres in the Somali region of Ethiopia. This information provides the …
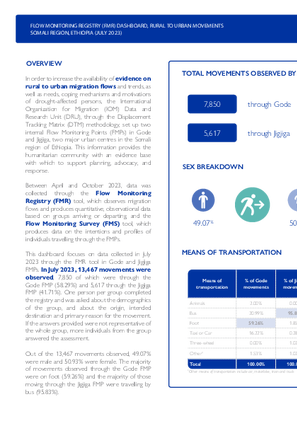
Ethiopia — Rural to Urban Movements in Somali Region, Internal Flow Monitoring Dashboard (July 2023)
In order to increase the availability of evidence on rural to urban migration flows and trends as well as needs coping mechanisms and motivations of droughtaffected persons the International Organizat…
Ethiopia — Flow Monitoring Dashboard 53 (February 2024)
In February 2024 a total of 36277 movements were observed across the six flow monitoring points FMPs in Ethiopia This represents a 42 decrease in daily average movements in comparison with January 202…

Ethiopia — Flow Monitoring Dashboard 52 (January 2024)
In January 2024 a total of 40464 movements were observed across the six flow monitoring points FMPs in Ethiopia This represents a 57 increase in daily average movements in comparison with December 202…

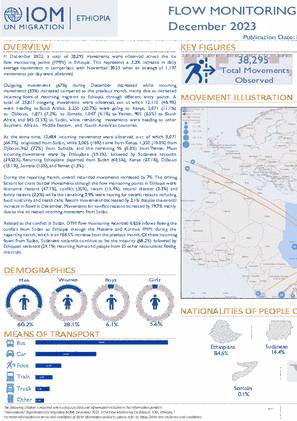
Ethiopia — Flow Monitoring Dashboard 51 (December 2023)
In December 2023 a total of 38295 movements were observed across the six flow monitoring points FMPs in Ethiopia This represents a 32 increase in daily average movements in comparison with November 20…
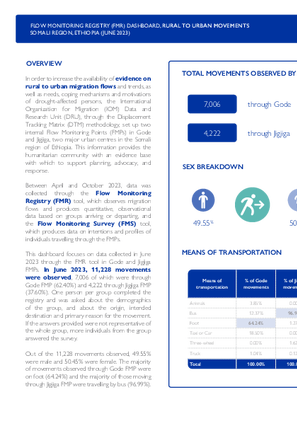
Ethiopia — Rural to Urban Movements in Somali Region, Internal Flow Monitoring Dashboard (June 2023)
In order to increase the availability of evidence on rural to urban migration flows and trends as well as needs coping mechanisms and motivations of droughtaffected persons the International Organizat…
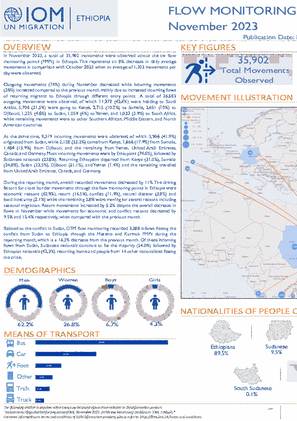
Ethiopia — Flow Monitoring Dashboard 50 (November 2023)
In November 2023 a total of 35902 movements were observed across the six flow monitoring points FMPs in Ethiopia This represents an 8 decrease in daily average movements in comparison with October 202…
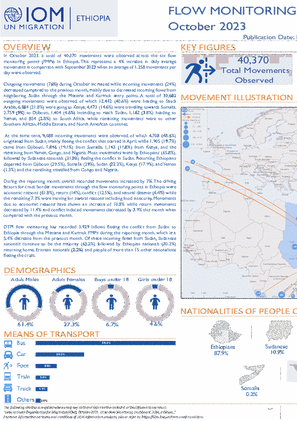
Ethiopia — Flow Monitoring Dashboard 49 (October 2023)
In October 2023 a total of 40370 movements were observed across the six flow monitoring points FMPs in Ethiopia This represents a 4 increase in daily average movements in comparison with September 202…
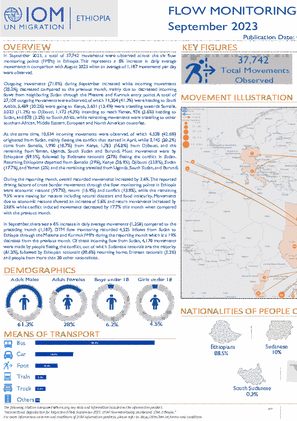
Ethiopia — Flow Monitoring Dashboard 48 (September 2023)
In September 2023 a total of 37742 movements were observed across the six flow monitoring points FMPs in Ethiopia This represents a 6 increase in daily average movements in comparison with August 2023…
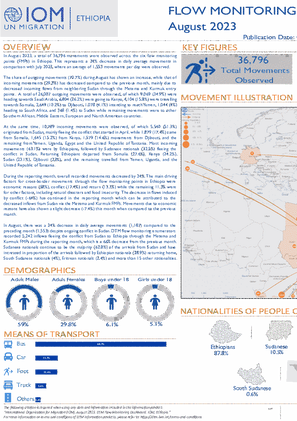
Ethiopia — Flow Monitoring Dashboard 47 (August 2023)
… Kuwait Moldova, Republic of Guinea-Bissau Cyprus Montenegro Gambia Lebanon Equatorial …
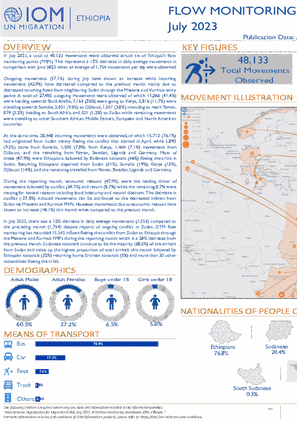
Ethiopia — Flow Monitoring Dashboard 46 (July 2023)
In July 2023 a total of 48133 movements were observed across six of Ethiopias flow monitoring points FMPs This represents a 12 decrease in daily average movements in comparison with June 2023 when an…
Ethiopia — Flow Monitoring Survey Report 13 (October - December 2022)
Between 1 October and 31 December 2022 the International Organization for Migration IOM through its Displacement Tracking Matrix DTM methodology deployed the Flow Monitoring Survey FMS across the 5 Fl…
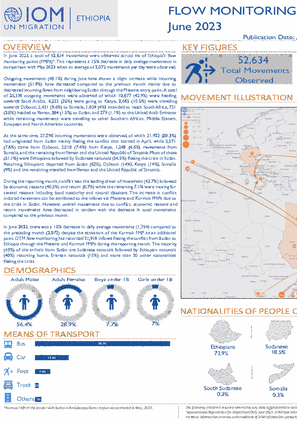
Ethiopia — Flow Monitoring Dashboard 45 (June 2023)
In June 2023 a total of 52634 movements were observed across six of Ethiopias flow monitoring points FMPs This represents a 15 decrease in daily average movements in comparison with May 2023 when an a…
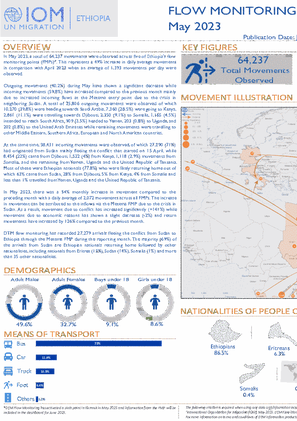
Ethiopia — Flow Monitoring Dashboard 44 (May 2023)
In May 2023 a total of 64237 movements were observed across five of Ethiopias flow monitoring points FMPs This represents a 49 increase in daily average movements in comparison with April 2023 when an…
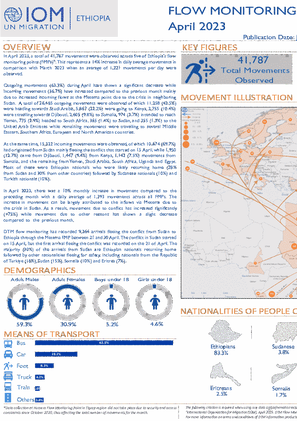
Ethiopia — Flow Monitoring Dashboard 43 (April 2023)
In April 2023 a total of 41787 movements were observed across five of Ethiopias flow monitoring points FMPs This represents a 14 increase in daily average movements in comparison with March 2023 when…
Ethiopia — Flow Monitoring Dashboard 42 (March 2023)
In March 2023 a total of 37846 movements were observed across five of Ethiopias flow monitoring points FMPs This represents a 10 increase in daily average movements in comparison with February 2023 wh…

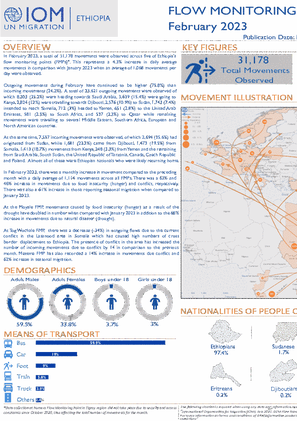
Ethiopia — Flow Monitoring Dashboard 41 (February 2023)
In February 2023 a total of 31178 movements were observed across five of Ethiopias flow monitoring points FMPs This represents a 43 increase in daily average movements in comparison with January 2023…
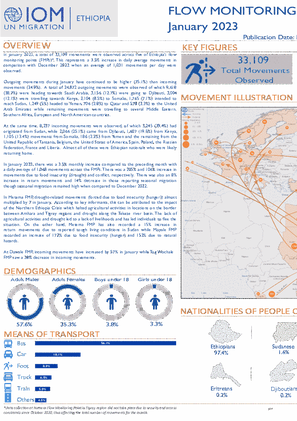
Ethiopia — Flow Monitoring Dashboard 40 (January 2023)
In January 2023 a total of 33109 movements were observed across five of Ethiopias flow monitoring points FMPs This represents a 35 increase in daily average movements in comparison with December 2022…
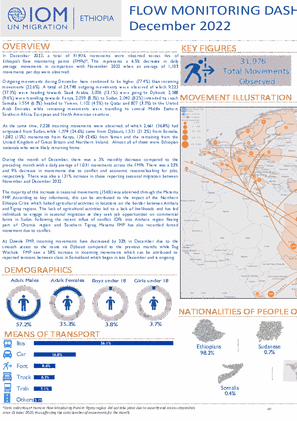
Ethiopia — Flow Monitoring Dashboard 39 (December 2022)
In December 2022 a total of 31976 movements were observed across five of Ethiopias flow monitoring points FMPs This represents a 65 decrease in daily average movements in comparison with November 2022…
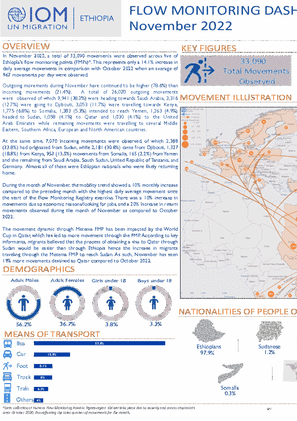
Ethiopia — Flow Monitoring Dashboard 38 (November 2022)
In November 2022 a total of 33090 movements were observed across five of Ethiopias flow monitoring points FMPs This represents only a 141 increase in daily average movements in comparison with October…