-
Countries
-
Data and Analysis
-
Special Focus
-
Crisis Responses
Ethiopia - Countrywide Monitoring
Feb 15 2017
Print
Countries in this response
- Active DTM operation
- Past DTM operation
Check out the interactive dashboard
Ethiopia - Site Assessment Dashboard
Ethiopia — National Displacement Report 9 (June — July 2021)
In order to capture the displacement and return dynamics in Ethiopia, DTM Ethiopia's National Displacement Report combines findings from its Site Assessment (SA) in Section 1 and findings from the Village Assessment Survey (VAS) in Section 2.
Ethiopia — Household Level Intention Survey: Tigray Region (July 2021)
In July 2021, the International Organization for Migration (IOM)'s Displacement Tracking Matrix (DTM), Camp Coordinaton and Camp Management (CCCM) Cluster and Protection Cluster worked together to carry out household level intention surveys in Tigray region for the first time. In response to
Ethiopia — Flow Monitoring Dashboard 22 (July 2021)
In July 2021, a total of 22,046** movements were observed across Ethiopia’s five flow monitoring points (FMPs).
Ethiopia — Emergency Site Assessment 7 (1 — 26 June 2021)
From 1— 26 June 2021, the Displacement Tracking Matrix (DTM) deployed its Emergency Site Assessment to capture internal displacement related to the Northern Ethiopia Crisis.
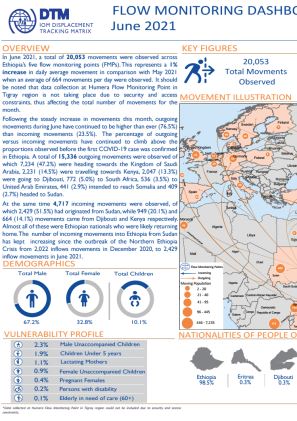
Ethiopia — Flow Monitoring Dashboard 21 (June 2021)
In June 2021, a total of 20,053 movements were observed across Ethiopia’s five flow monitoring points (FMPs). Following the steady increase in movements this month, outgoing movements during June have continued to be higher than ever (76.5%) than incoming movements (23.5%). The percent
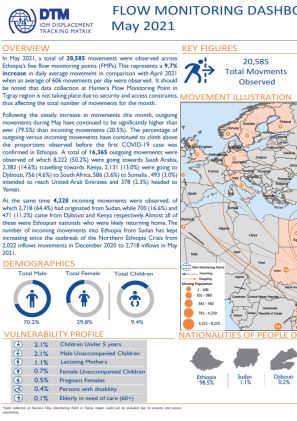
Ethiopia — Flow Monitoring Dashboard 20 (May 2021)
n May 2021, a total of 20,585 movements were observed across Ethiopia’s five flow monitoring points (FMPs). Following the steady increase in movements this month, outgoing movements during May have continued to be significantly higher than ever (79.5%) than incoming movements (20.5%). T
Ethiopia — National Displacement Report 8 (March — April 2021)
In order to capture the displacement and return dynamics in Ethiopia, DTM Ethiopia's National Displacement Report combines findings from its Site Assessment (SA) in Section 1 and findings from the Village Assessment Survey (VAS) in Section 2.
Ethiopia — Flow Monitoring Dashboard 19 (April 2021)
In April 2021, a total of 18,166 movements were observed across Ethiopia’s five flow monitoring points (FMPs). This represents a 3% decrease in daily average movement in comparison with March 2021 when an average of 627 movements per day were observed.
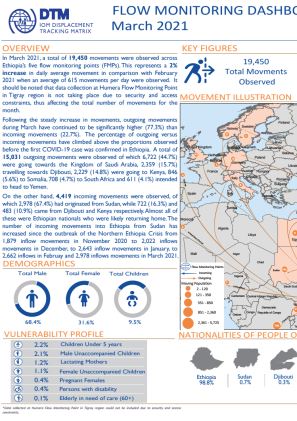
Ethiopia — Flow Monitoring Dashboard 18 (March 2021)
In March 2021, a total of 19,450 movements were observed across Ethiopia’s five flow monitoring points (FMPs). Following the steady increase in movements, outgoing movements during March have continued to be significantly higher (77.3%) than incoming movements (22.7%). The percentage of
Ethiopia — National Displacement Report 7 (December 2020 — January 2021)
In order to capture the displacement and return dynamics in Ethiopia, DTM Ethiopia's National Displacement Report combines findings from its Site Assessment (SA) in Section 1 and findings from the Village Assessment Survey (VAS) in Section 2.
Ethiopia — Flow Monitoring Dashboard 17 (February 2021)
In February 2021, a total of 17,216 movements were observed across Ethiopia’s five flow monitoring points (FMPs) whereby outgoing movements during February have continued to be significantly higher (77%) than incoming movements (23%). The percentage of outgoing versus incoming movements have
Ethiopia — Flow Monitoring Dashboard 16 (January 2021)
In January 2021, a total of 17,316 movements were observed across Ethiopia’s five flow monitoring points (FMPs) whereby outgoing movements during January have continued to be significantly higher (77%) than incoming movements (23%). The percentage of outgoing versus incoming movements have c


