-
Countries
-
Data and Analysis
-
Special Focus
-
Crisis Responses
Ethiopia - Countrywide Monitoring
Feb 15 2017
Print
Countries in this response
- Active DTM operation
- Past DTM operation
Check out the interactive dashboard
Ethiopia - Site Assessment Dashboard
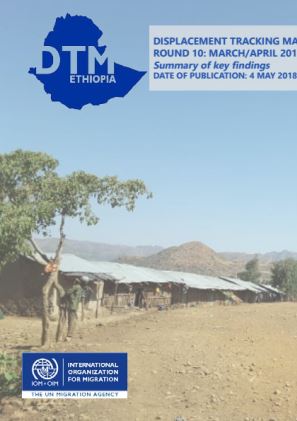
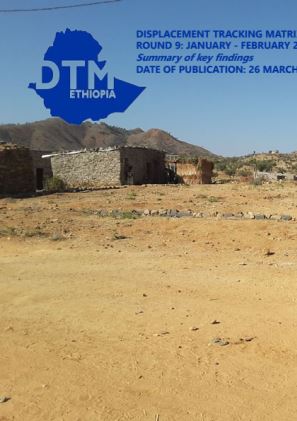
Ethiopia — Displacement Report 10, Amhara Region (5 March —5 April 2018)
6,888 displaced individuals comprising 1,475 households in 25 displacement sites were identified in Amhara region. These figures represent a decrease of 5,212 in the total individuals (-43.07%) a decrease of 937 households (-38%) since round 9 (January/February 2018).
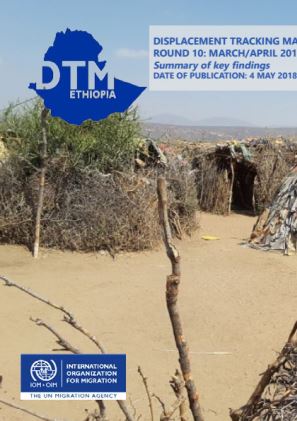
Ethiopia — Displacement Report 10, Somali Region (5 March —5 April 2018)
764,145 displaced individuals comprising127,299 households in 347 displacement sites were identified in Somali region.
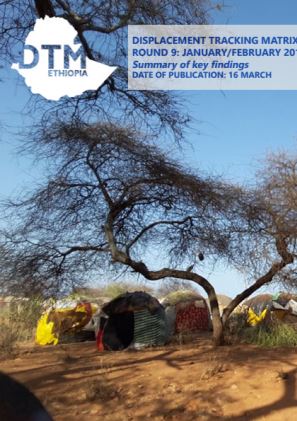
Ethiopia — Displacement Report 9, Somali Region (January — February 2018)
832,652 displaced individuals comprising 127,920 households in 338 displacement sites were identified in Somali region.
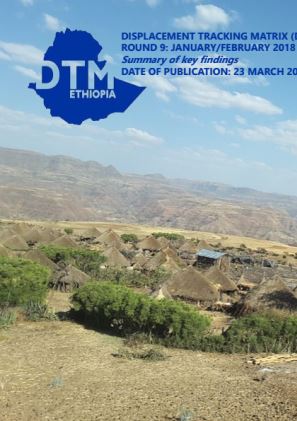
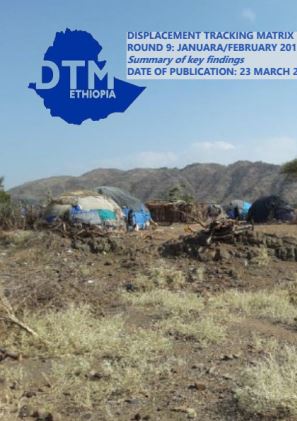
Ethiopia — Displacement Report 9, Amhara Region (January — February 2018)
12,100 displaced individuals comprising 2,412 households in 23 displacement sites were identified in Amhara region. These figures represent an increase of 531 in the total individuals (+4.59%) an increase of 29 households (+1.22%) and 1 site (+4.55%) since round 8 (November/December 2017).
Ethiopia — Displacement Report 9, Tigray Region (4 January —8 February 2018)
22,488 displaced individuals comprising 7,941 households in 60 displacement sites were identified in Tigray region.
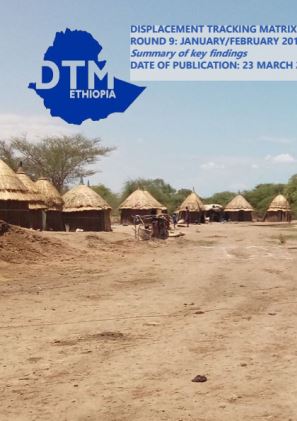
Ethiopia — Displacement Report 9, Afar Region (January — February 2018)
52,723 displaced individuals comprising 8,788 households in 55 displacement sites were identified in Afar region.
Ethiopia — Displacement Report 9, Oromia Region (January — February 2018)
777,665 displaced individuals comprising 126,920 households in 418 displacement sites were identified in Oromia region.
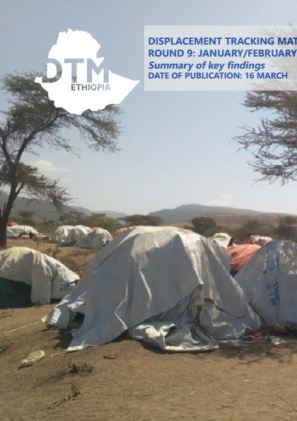
Ethiopia — Displacement Report 9, Gambella Region (4 January —8 February 2018)
In the Gambella Region, DTM identified 22,909 displaced individuals comprising 4,582 households in 17 displacement sites. These figures represent an increase of 1,339 in the total individuals (+6.21%) an increase of 268 households (+6.21%) and a decrease of 4 sites (-19.05%) since Round 8 (N
Ethiopia — National Displacement Dashboard (January — February 2018)
The majority of the recorded population were displaced during 2017, with 621 reportedly opening that year (DTM Rounds 3-8). Conflict was reported as the primary driver of displacement (1,217,793 IDPs), followed by climate-induced factors (494,256 IDPs).
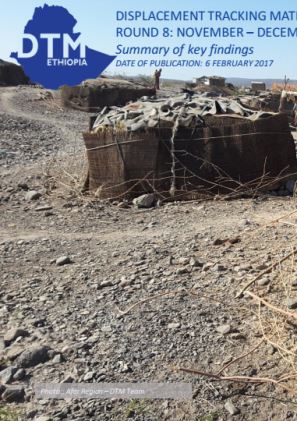
Ethiopia — Displacement Report 8, Afar Region (November — December 2017)
52,933 displaced individuals comprising 8,828 households in 54 displacement sites were identified in Afar region. These figures represent a decrease of 2,152 in the total individuals (4%) and households (14%) since round 7 (September/October). The number of sites remained the same.
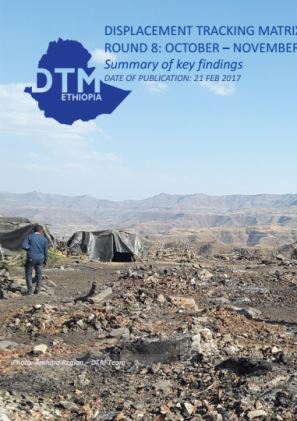
Ethiopia — Displacement Report 8, Amhara Region (October — November 2017)
11,569 displaced individuals comprising 2,383 households in 22 displacement sites were identified in the Amhara region.
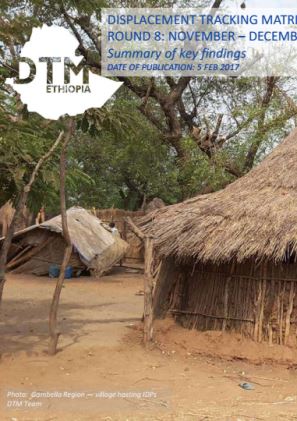
Ethiopia — Displacement Report 8, Gambella Region (3 November — 8 December 2018)
In the Gambella Region, DTM identified 21,570 displaced individuals comprising 4,314 households in 21 displacement sites.

