
May 20 2022
- Mobility Tracking
- Baseline Assessment
- Points of Entry (PoE)
During the COVID-19 pandemic, IOM's Displacement Tracking Matrix (DTM), in collaboration with the World Health Organization (WHO), monitors cross-border movements to and from Nigeria's Borno State in north-east Nigeria. Assessments are conducted at Points of Entry located along the border with Cameroon.
A range of data was collected during the assessments to better inform on travellers’ nationalities, sex, reasons for moving, mode of transportation and timeline of movement as shown in figures 2 to 5 below.

May 22 2022
- Mobility Tracking
- Event Tracking
Nigeria's north-central and north-west zones are afflicted with a multidimen-sional crisis rooted in long-standing tensions between ethnic and religious groups and involves attacks by criminal groups and banditry/hirabah (such as kidnapping and grand larceny along major highways). During the past years, the crisis has accelerated because of the intensification of attacks and has resulted in widespread displacement across the region.
Between the 16th and 22nd of May 2022, armed clashes and banditry have led to new waves of population displacement. Following these events, rapid assessments were conducted by DTM (Displacement Tracking Matrix) field staff to inform the humanitarian community and government partners, and enable targeted response. Flash reports utilise direct observation and a broad network of key informants to gather representative data and collect informa-tion on the number, profile and immediate needs of affected populations.
During the assessment period, the DTM identified an estimated 5,570 individu-als who were affected by the attacks. A total of 5,509 individuals were displaced to neighbouring wards in the LGAs Bakura, Bukkuyum and Gusau in Zamfara State. A total of 119 casualties were reported, including 58 injuries and 61 fatalities.

Oct 23 2021
- Survey
- Return Intention
Between September and November 2021, the International Organization for Migration’s Displacement Tracking Matrix (IOM DTM) undertook its second household-level multi-sector assessment of selected urban areas and camps for internally displaced persons (IDPs) in South Sudan. The assessment aims to:
- Quantify the prevalence of vulnerabilities and humanitarian needs across sectors, with a focus on food security, economic vulnerability and nutrition as well as selected indicators on shelter and non-food items (SNFI), education, health, water, hygiene and sanitation (WASH), protection (including child protection and gender-based violence) and mental health and psycho-social support (MHPSS).
- Generate a better understanding of urban displacement and migration, including return and relocation after displacement in South Sudan or abroad.
This survey is part of the country-wide extended Food Security and Nutrition Monitoring System (FSNMS+) assessment in South Sudan, jointly conducted by IOM, the World Food Programme (WFP), the United Nations Children’s Fund (UNICEF), the Food and Agriculture Organization (FAO), the United Nations Office for the Coordination of Humanitarian Affairs (OCHA), REACH and several humanitarian clusters. It was designed to be an independent, crisis-wide and coordinated inter-agency multi-sectoral needs assessment, mandated by the Humanitarian Country Team and endorsed by the Inter- Cluster Coordination Group. Together, the joint findings provide an evidence-base for the Integrated Food Security Phase Classification, the Humanitarian Needs Overview and the Humanitarian Response Plan.
This report presents sectoral findings for the urban area of Malakal.
Separate profiles have been published for the urban areas of Juba, Wau, Bor, Yei and Bentiu / Rubkona.
Further profiles will be published for Juba IDP Camps I and III, Naivasha IDP Camp, Bentiu IDP Camp and Malakal Protection of Civilians (PoC) Site.
Oct 21 2021
- Survey
- Return Intention
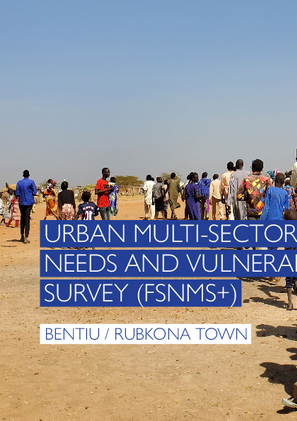
Between September and November 2021, the International Organization for Migration’s Displacement Tracking Matrix (IOM DTM) undertook its second household-level multi-sector assessment of selected urban areas and camps for internally displaced persons (IDPs) in South Sudan. The assessment aims to:
- Quantify the prevalence of vulnerabilities and humanitarian needs across sectors, with a focus on food security, economic vulnerability and nutrition as well as selected indicators on shelter and non-food items (SNFI), education, health, water, hygiene and sanitation (WASH), protection (including child protection and gender-based violence) and mental health and psycho-social support (MHPSS).
- Generate a better understanding of urban displacement and migration, including return and relocation after displacement in South Sudan or abroad.
This survey is part of the country-wide extended Food Security and Nutrition Monitoring System (FSNMS+) assessment in South Sudan, jointly conducted by IOM, the World Food Programme (WFP), the United Nations Children’s Fund (UNICEF), the Food and Agriculture Organization (FAO), the United Nations Office for the Coordination of Humanitarian Affairs (OCHA), REACH and several humanitarian clusters. It was designed to be an independent, crisis-wide and coordinated inter-agency multi-sectoral needs assessment, mandated by the Humanitarian Country Team and endorsed by the Inter- Cluster Coordination Group. Together, the joint findings provide an evidence-base for the Integrated Food Security Phase Classification, the Humanitarian Needs Overview and the Humanitarian Response Plan.
This report presents sectoral findings for the urban area of Bentiu / Rubkona.
Separate profiles have been published for the urban areas of Juba, Wau, Bor, Yei and Malakal.
Further profiles will be published for Juba IDP Camps I and III, Naivasha IDP Camp, Bentiu IDP Camp and Malakal Protection of Civilians (PoC) Site.

Nov 01 2021
- Survey
- Return Intention
Between September and November 2021, the International Organization for Migration’s Displacement Tracking Matrix (IOM DTM) undertook its second household-level multi-sector assessment of selected urban areas and camps for internally displaced persons (IDPs) in South Sudan. The assessment aims to:
- Quantify the prevalence of vulnerabilities and humanitarian needs across sectors, with a focus on food security, economic vulnerability and nutrition as well as selected indicators on shelter and non-food items (SNFI), education, health, water, hygiene and sanitation (WASH), protection (including child protection and gender-based violence) and mental health and psycho-social support (MHPSS).
- Generate a better understanding of urban displacement and migration, including return and relocation after displacement in South Sudan or abroad.
This survey is part of the country-wide extended Food Security and Nutrition Monitoring System (FSNMS+) assessment in South Sudan, jointly conducted by IOM, the World Food Programme (WFP), the United Nations Children’s Fund (UNICEF), the Food and Agriculture Organization (FAO), the United Nations Office for the Coordination of Humanitarian Affairs (OCHA), REACH and several humanitarian clusters. It was designed to be an independent, crisis-wide and coordinated inter-agency multi-sectoral needs assessment, mandated by the Humanitarian Country Team and endorsed by the Inter- Cluster Coordination Group. Together, the joint findings provide an evidence-base for the Integrated Food Security Phase Classification, the Humanitarian Needs Overview and the Humanitarian Response Plan.
This report presents sectoral findings for the urban area of Bor.
Separate profiles have been published for the urban areas of Juba, Wau, Yei, Bentiu / Rubkona and Malakal.
Further profiles will be published for Juba IDP Camps I and III, Naivasha IDP Camp, Bentiu IDP Camp and Malakal Protection of Civilians (PoC) Site.

Oct 23 2021
- Survey
- Return Intention
Between September and November 2021, the International Organization for Migration’s Displacement Tracking Matrix (IOM DTM) undertook its second household-level multi-sector assessment of selected urban areas and camps for internally displaced persons (IDPs) in South Sudan. The assessment aims to:
- Quantify the prevalence of vulnerabilities and humanitarian needs across sectors, with a focus on food security, economic vulnerability and nutrition as well as selected indicators on shelter and non-food items (SNFI), education, health, water, hygiene and sanitation (WASH), protection (including child protection and gender-based violence) and mental health and psycho-social support (MHPSS).
- Generate a better understanding of urban displacement and migration, including return and relocation after displacement in South Sudan or abroad.
This survey is part of the country-wide extended Food Security and Nutrition Monitoring System (FSNMS+) assessment in South Sudan, jointly conducted by IOM, the World Food Programme (WFP), the United Nations Children’s Fund (UNICEF), the Food and Agriculture Organization (FAO), the United Nations Office for the Coordination of Humanitarian Affairs (OCHA), REACH and several humanitarian clusters. It was designed to be an independent, crisis-wide and coordinated inter-agency multi-sectoral needs assessment, mandated by the Humanitarian Country Team and endorsed by the Inter- Cluster Coordination Group. Together, the joint findings provide an evidence-base for the Integrated Food Security Phase Classification, the Humanitarian Needs Overview and the Humanitarian Response Plan.
This report presents sectoral findings for the urban area of Wau.
Separate profiles have been published for the urban areas of Juba, Bor, Yei, Bentiu / Rubkona and Malakal.
Further profiles will be published for Juba IDP Camps I and III, Naivasha IDP Camp, Bentiu IDP Camp and Malakal Protection of Civilians (PoC) Site.
May 12 2022
- Other
- Survey
- Community Perception
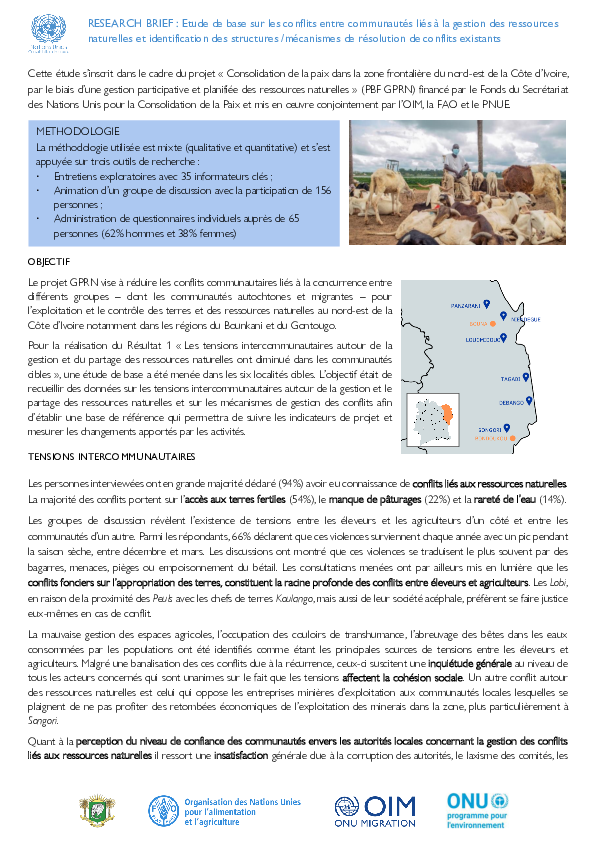
Une étude de base a été menée dans les six localités cibles. L’objectif était de recueillir des données sur les tensions intercommunautaires autour de la gestion et le partage des ressources naturelles et sur les mécanismes de gestion des conflits afin de réduire les conflits communautaires liés à la concurrence entre différents groupes – dont les communautés autochtones et migrantes – pour l’exploitation et le contrôle des terres et des ressources naturelles au nord-est de la Côte d’Ivoire notamment dans les régions du Bounkani et du Gontougo.
Reporting directly
DTM Country Coordinator
Duty Station
Warsaw, Poland
Number of positions
1
Starting Date
As soon as possible
Type
Professional Staff, Grade UG
Closing Date
2022-05-31
Status
Open
I. ORGANIZATIONAL CONTEXT AND SCOPE
Established in 1951, IOM is the leading inter-governmental organization in the field of migration and works closely with governmental, intergovernmental and non-governmental partners. The International Organization for Migration (IOM) is committed to the principle that humane and orderly migration benefits migrants and society. As the leading international organization for migration, IOM acts with its partners in the international community to: assist in meeting the growing operational challenges of migration management; advance understanding of migration issues; encourage social and economic development through migration, and; uphold the human dignity and well-being of migrants.
IOM has been active in Poland since 2002 under an agreement with the Polish government and conducts various migration programs, including activities supporting the integration of male and female migrants into Polish society. IOM in Poland implements projects aimed at the private sector to promote ethical recruitment, respect for the rights of migrants and migrant women as well as the elimination of forced labour from value chains and the prevention of human trafficking.
Following the launch of military operations across Ukrainian territory on 24 February 2022, substantive flows and displacements across Ukraine and toward neighbouring countries have been reported countries in the following days. While air travel has been suspended in Ukraine and Moldova, Ukraine shares land border with four European Union (EU) Member States: Poland, Romania, Hungary and Slovakia. Other non-EU countries (3) which share their border with Ukraine include Republic of Moldova, Russian Federation and Belarus. Large in and out flows to and through Moldova of Ukrainian and Third Country nationals created the need to set up a monitoring system and analyse the trends and patterns of mobility.
Under the direct supervision of the DTM Country Coordinator, the DTM Reporting Coordinator is responsible for analysing and developing information products from DTM activities.
II. RESPONSIBILITIES AND ACCOUNTABILITIES
- Analyze the collected data on arrivals, exits and presence of Ukrainian and third country nationals to, from and in Poland.
- Produce reports and other information outputs (eg. infographics, maps, charts and graphs) based on the collected data, including, analysis of the displacement patterns, needs and intentions of displaced population.
- Analyze collected data and available information from the perspective of IOM and national counterparts to identify data gaps and propose approaches and mechanisms to address those needs.
- Support development of data collection methodologies, tools (eg. survey design) and processes as well as develop guidelines and standard operating procedures for data enumerators.
- Train the data collectors on the specific questionnaire to ensure harmonized understanding of the formulated questions and options and ensure compatibility of the collected data.
- Ensure that the developed reports and info/products are in line with the Global DTM Analytical, Knowledge and Output (AKO) unit to ensure all outputs are aligned with global DTM Standards
- Liaise with relevant authorities, UN agencies, NGOs, think tanks, government authorities, and other stakeholders on issues relevant to the programme. Represent IOM at relevant meetings.
- Support the IM Officer in ensuring the dissemination and adaption as necessary of information management tools that meet partners’ and other humanitarian actors’ needs.
- Support and represent the role and functions of the DTM programme within cluster/sectoral activities.
- Ensure adherence to IOM data protection principles in regard to collection, use, storage, disclosure and disposal of personal data.
- Perform such other duties as may be assigned.
III. REQUIRED QUALIFICATIONS AND EXPERIENCE
EDUCATION
- Master’s degree in Business Administration, International Relations, Political Science, Communications, Information Management, Computer Science or a related field from an accredited academic institution with two years of relevant professional experience; or
- University degree in the above fields with four years of relevant professional experience.
EXPERIENCE AND SKILLS
- Experience working in international organizations and the humanitarian community;
- Experience in the development and implementation of population databases a distinct advantage;
- Experience in relevant issues such as migration, displacement, and humanitarian assistance would be an asset.
- Statistical analysis (STATA, SPSS, etc);
- Experience working in graphic softwares (e.g. Microsoft PowerBi, Adobe Illustrator, Adobe InDesign)
- Data collection, research, and report writing;
- Writing technical requirements documents, translating/planning specifications to technical briefs for data capture/analysis, and compiling diverse datasets;
- Strong computer background, including experience with relational databases, Microsoft applications, spreadsheets, and word processing.
IV. LANGUAGES
Fluency in English (written and oral) is required. Polish and Ukrainian proficiency is advantage.
V. COMPETENCIES
IOM’s competency framework can be found at this link.
Values
- Inclusion and respect for diversity: respects and promotes individual and cultural differences; encourages diversity and inclusion wherever possible.
- Integrity and transparency: maintains high ethical standards and acts in a manner consistent with organizational principles/rules and standards of conduct.
- Professionalism: demonstrates ability to work in a composed, competent and committed manner and exercises careful judgment in meeting day-to-day challenges.
Core Competencies – behavioural indicators
- Teamwork: develops and promotes effective collaboration within and across units to achieve shared goals and optimize results.
- Delivering results: produces and delivers quality results in a service-oriented and timely manner; is action oriented and committed to achieving agreed outcomes.
- Managing and sharing knowledge: continuously seeks to learn, share knowledge and innovate.
- Accountability: takes ownership for achieving the Organization’s priorities and assumes responsibility for own action and delegated work.
- Communication: encourages and contributes to clear and open communication; explains complex matters in an informative, inspiring and motivational way.
Managerial Competencies – behavioral indicators
- Leadership: provides a clear sense of direction, leads by example and demonstrates the ability to carry out the organization’s vision; assists others to realize and develop their potential.
- Empowering others & building trust: creates an atmosphere of trust and an enabling environment where staff can contribute their best and develop their potential.
- Strategic thinking and vision: works strategically to realize the Organization’s goals and communicates a clear strategic direction.
Other:
IOM is committed to a diverse and inclusive environment.
This post is subject to local recruitment. Only those holding a valid residence and work permit for Poland will be eligible for consideration.
Any offer made to the candidate in relation to this vacancy notice is subject to funding confirmation.
At the time of recruitment, all candidates must disclose any known relative or spouse who works for IOM. Candidates may also be requested to provide documentary evidence of academic degree(s), professional licenses, and proof of no criminal records as relevant to the requirements of the position advertised.
Appointment will be subject to certification that the candidate is medically fit for appointment, verification of residency, visa, and authorizations by the concerned Government, where applicable.
Vaccination against COVID-19 will be required for IOM personnel who are hired or otherwise engaged by IOM. As part of the mandatory medical entry on duty clearance, candidates will be requested to provide evidence of full vaccination.
HOW TO APPLY
Interested candidates are invited to submit their application including a CV and a completed Personal History Form in English by email to: IOMPolandHR@iom.int , specifying the vacancy reference number PLCFA22-054 and full name in the subject line.
Please click this link to access the Personal History Form (two pages).
NOTE: Due to the volume of applications received, IOM Poland will not be able to respond to all inquiries about the application status and will only contact shortlisted candidates.
May 12 2022
- Other
- Survey
- Community Perception
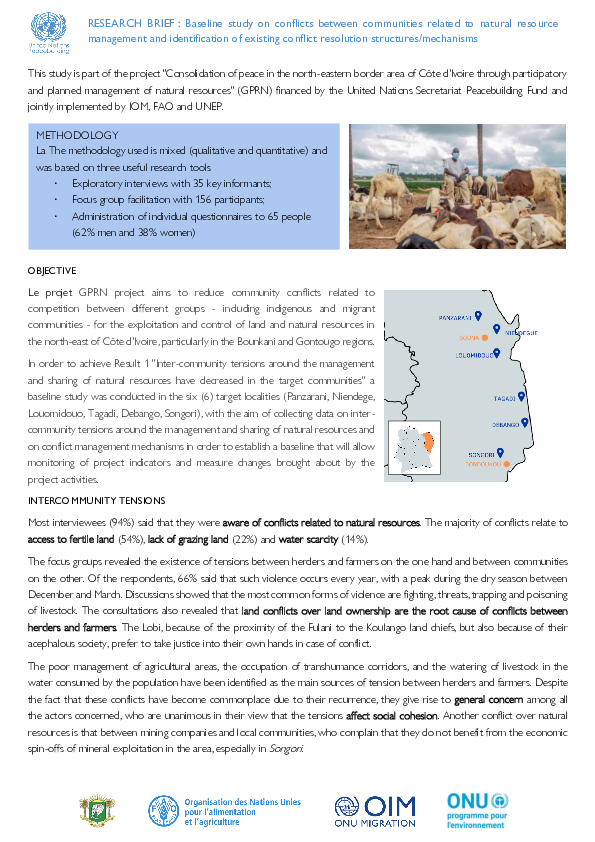
A baseline study was conducted in the six (6) target localities (Panzarani, Niendege, Louomidouo, Tagadi, Debango, Songori), with the aim of collecting data on inter-community tensions around the management and sharing of natural resources and on conflict management mechanisms, so as to reduce community conflicts related to competition between different groups - including indigenous and migrant communities - for the exploitation and control of land and natural resources in the north-east of Côte d'Ivoire, particularly in the Bounkani and Gontougo regions.
May 12 2022
- Other
- Survey
- Community Perception
Une étude de base a été mené du 24 avril au 12 Mai 2012 dans les six (6) localités cibles, dans le but d’avoir une compréhension plus approfondie du niveau de cohésion sociale et des mécanismes de gestion des conflits dans les localités afin de favoriser le dialogue ; l’élaboration de plans participatifs de gestion du territoire et leur suivi ; le renforcement des compétences des autorités étatiques locales en matière de résolution de conflits liés à la gestion et au partage des ressources naturelles dans les régions du Gontougo et du Boukani.

DTM Global Survey 2023
The Displacement Tracking Matrix (DTM) Global Survey 2023 is an annual stocktaking exercise which aims to present IOM DTM's operations and activities transparently. The Global Survey focuses on operations active from January 1 to December 31, 2023, with data collection occurring from February to April 2024.