Ethiopia


About Ethiopia
Ethiopia faces one of the most complex human mobility environments in the world, with a range of social, economic, political, and climatic factors driving populations within and outside its borders. .
The Data and Research Unit (DRU) at IOM Ethiopia, through its Displacement Tracking Matrix (DTM) methodology, gathers and analyzes data to disseminate critical multi layered information on the mobility, vulnerabilities, and needs of displaced and mobile populations that enables decision makers and responders to provide these populations with better context specific assistance. Since its launch in September 2016 in Ethiopia, the DTM has grown to be a fully integrated component of Ethiopia’s national and sub-national information management architecture, as it is the official source of data on internal displacement in the country. In Ethiopia, DRU implements the following three DTM components: Mobility Tracking (MT), Flow Monitoring (FM) and Surveys.
Mobility Tracking (MT) captures internal displacement and return through three annual rounds of Site Assessment (SA) (focused on IDPs, their multisectoral needs and the availability of services in their areas of displacement) and Village Assessment Survey (VAS) (focused on host community capacity to absorb returns targeting returning IDPs and their access to services with a focus on livelihoods and reintegration). MT data is largely used to inform humanitarian response and development planning and as such is coordinated with both humanitarian and development actors in country as well as with the Ethiopia Disaster Risk Management Commission.
Flow Monitoring (FM) captures inter-and intra-regional migration flows daily at key identified transit locations. This information is largely used to inform developmental programming including migrant assistance and protection programming. Through a route-based analysis, FM data has played a pivotal role in providing evidence base to respond to the Sudan crisis coordination.
Through the regular nationwide SA and VAS tools that fall under the MT component of the DTM methodology, the DRU builds and regularly updates a master-list of locations and information about how mobile population categories are geographically spread throughout the country. The baseline information contained in the master-lists allows for the construction of sampling frameworks and the selection of statistically representative samples. Using the sampling frameworks obtained through the nationwide regular assessments, DRU is able to plan and implement household level and individual Surveys to provide representative, granular information which can be triangulated with pre-existing DTM data, as well as external data sources. This data enables the humanitarian and development communities to obtain important insight into the needs, conditions, vulnerabilities, and intentions of mobile populations which can be particularly useful in informing programs, especially with regards to durable solutions, livelihoods, and other Humanitarian, Development and Peace Nexus (HDPN) related programming and policy initiatives.
DTM Ethiopia deploys over 200 staff and enumerators to track displacement, returns and mobile populations in the country.
More information on the methodology can be found under resources.
Current Donors
- Norway
- USAID
- DG ECHO
- DG INTPA
- European Commission
- MPTF
13,477 displaced individuals comprising 2,695 households in 15 displacement sites were identified in Gambella region.

6,810 displaced individuals comprising 1,613 households in 32 displacement sites were identified in Amhara region.
53,401 displaced individuals comprising 8,914 households in 54 displacement sites were identified in Afar region.
30,112 displaced individuals comprising 10,892 households in 78 displacement sites were identified in Tigray region.

56,375 displaced individuals comprising 9,408 households in 56 displacement sites were identified in Afar region. These figures represent an increase of 3,652 in the total number of displaced individuals (+6.93%) since round 9 (January/February 2018).
721,307 displaced individuals comprising 118,227 households in 420 displacement sites were identified in Oromia region.
The site profile generator is a spreadsheet which can create site profiles for all sites covered during round 10.

In April 2018 IOM Ethiopia conducted a DTM partner feedback survey to enhance its program and service delivery.
This document contains a project overview for DTM Ethiopia in 2018.

This document contains a comprehensive overview of the DTM Ethiopia methodology.

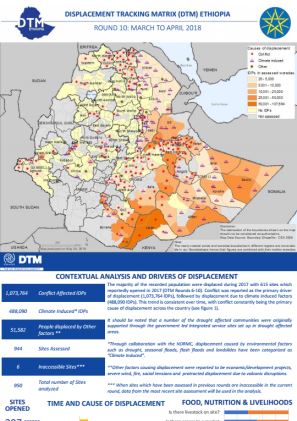
The majority of the recorded population were displaced during 2017 with 615 sites which reportedly opened in 2017. Conflict was reported as the primary driver of displacement (1,073,764 IDPs), followed by displacement due to conflict induced factors (488,090 IDPs).
6,888 displaced individuals comprising 1,475 households in 25 displacement sites were identified in Amhara region. These figures represent a decrease of 5,212 in the total individuals (-43.07%) a decrease of 937 households (-38%) since round 9 (January/February 2018).
12,277 displaced individuals comprising 2,453 households in 11 displacement sites were identified in GAMBELLA region.

764,145 displaced individuals comprising127,299 households in 347 displacement sites were identified in Somali region.
12,100 displaced individuals comprising 2,412 households in 23 displacement sites were identified in Amhara region. These figures represent an increase of 531 in the total individuals (+4.59%) an increase of 29 households (+1.22%) and 1 site (+4.55%) since round 8 (November/December 2017).
832,652 displaced individuals comprising 127,920 households in 338 displacement sites were identified in Somali region.
22,488 displaced individuals comprising 7,941 households in 60 displacement sites were identified in Tigray region.
In the Gambella Region, DTM identified 22,909 displaced individuals comprising 4,582 households in 17 displacement sites. These figures represent an increase of 1,339 in the total individuals (+6.21%) an increase of 268 households (+6.21%) and a decrease of 4 sites (-19.05%) since Round 8 (N
777,665 displaced individuals comprising 126,920 households in 418 displacement sites were identified in Oromia region.
52,723 displaced individuals comprising 8,788 households in 55 displacement sites were identified in Afar region.
The majority of the recorded population were displaced during 2017, with 621 reportedly opening that year (DTM Rounds 3-8). Conflict was reported as the primary driver of displacement (1,217,793 IDPs), followed by climate-induced factors (494,256 IDPs).

52,933 displaced individuals comprising 8,828 households in 54 displacement sites were identified in Afar region. These figures represent a decrease of 2,152 in the total individuals (4%) and households (14%) since round 7 (September/October). The number of sites remained the same.
11,569 displaced individuals comprising 2,383 households in 22 displacement sites were identified in the Amhara region.
772,242 displaced individuals comprising 124,982 households in 369 displacement sites were identified in Oromia region, which represents an increase of 46% in individuals and 53% in households. 79% of sites opened in 2017 and 27% of sites reported no access to food.


DTM API
Making global IDPs data accessible and reliable
The Displacement Tracking Matrix application programming interface (API) accelerates secure sharing of IDPs’ data, simplifying access to data across users and partners to support action, insight and foresight.