-
Countries
-
Data and Analysis
-
Special Focus
-
Crisis Responses
Lake Chad Basin Crisis
Feb 15 2017
Print
Countries in this response
- Active DTM operation
- Past DTM operation
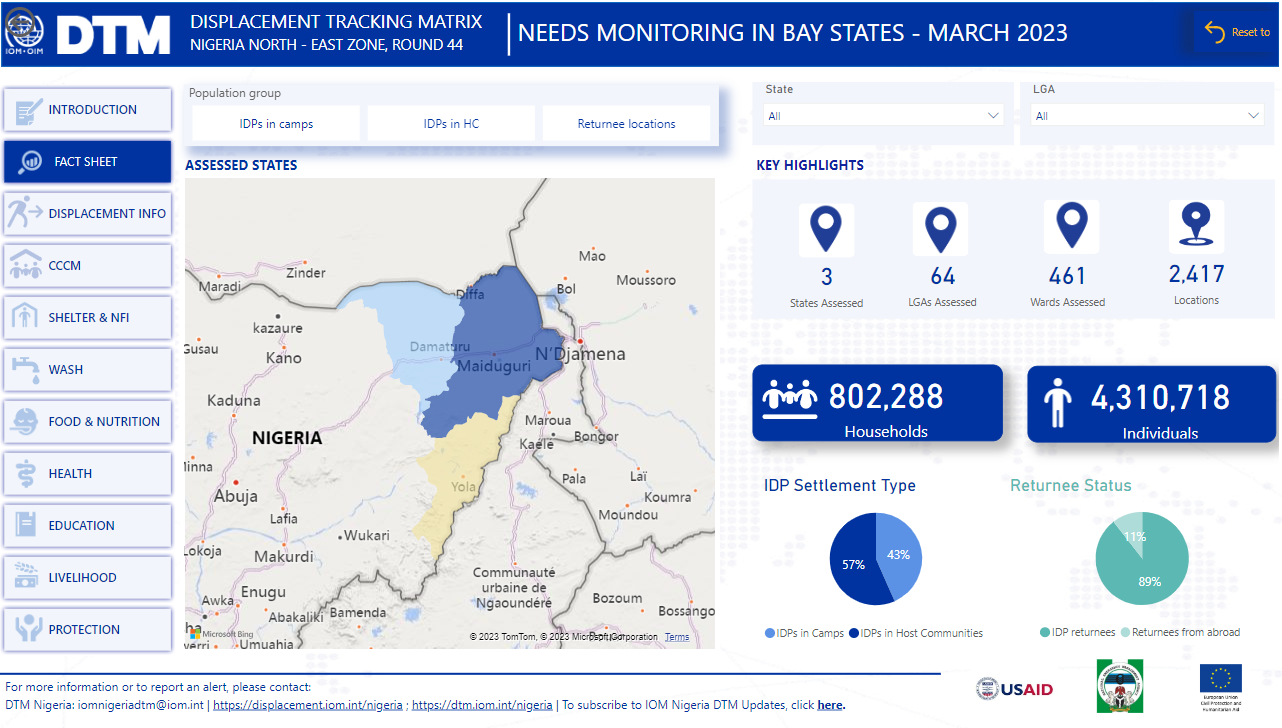
Check out the interactive dashboard
Nigeria - Needs Monitoring
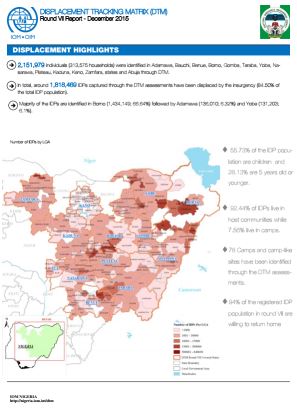
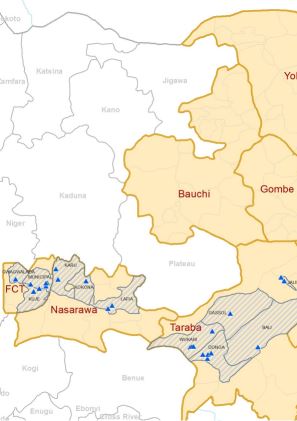
Nigeria — Displacement Dashboard 7 ( November — December 2015)
As of December 2015, 2,151,979 IDPs or 313,575 households were identified in the seventh round of assessments.
Nigeria — Displacement Report 7 (1 November — 31 December 2015)
2,151,979 IDPs (313,575 households) were identified in Adamawa, Bauchi, Benue, Borno, Gombe, Taraba, Yobe, Nasarawa, Plateau, Kaduna, Kano, Zamfara states and Abuja. Borno state (1,434,149 IDPs) has the highest number of IDPs, followed by Adamawa (136,010 IDPs) and Yobe (131,203 IDPs).
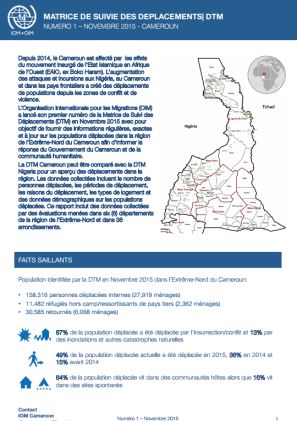
Cameroun — Rapport de Déplacement 1 (Novembre 2015)
Les donnée recueillies entre le 10 et 19 Novembre comportent des informations sur le nombre de personnes déplacées, la période de déplacement, le motif, le type de logement et les données démographiques sur les populations déplacées.
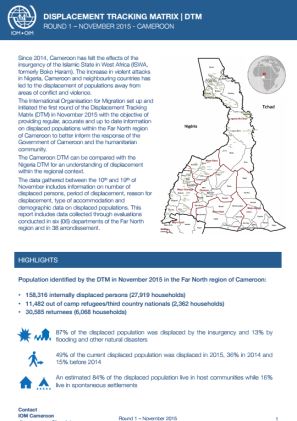
Cameroon — Displacement Report 1 (November 2015)
DTM identified 158,316 IDPs (27,919 households) in the Far North region of Cameroon, 11,482 out of camp refugees/ third country nationals (2,342 households) and 30,585 returnees (6,068 households).
Nov 30 2015
Cameroon — Displacement Report 1 (November 2015)
Nigeria — List of Wards Assessed 6 (1 Septembre — 31 Octobre 2015)
2,233,506 displaced individuals (318,937 households) were identified in Round 6 of DTM in Nigeria.This document provides the list of wards assessed and the numbers of individuals and households identified in each, organised by State and Local Government Area (LGA). 
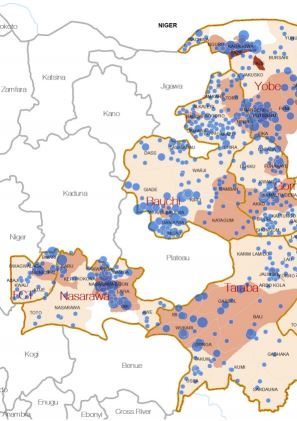
Nigeria — Displacement Dashboard 6 (September — October 2015)
As of October 2015, 2,233,506 IDPs in 318,937 households were identified in the sixth round of assessments. The dashboard includes a map of displacement severity by Local Government Area (LGA) and ward.
Nigeria — Displacement Report 6 (1 September — 31 October 2015)
2,233,506 IDPs (318,937 households) were identified in Adamawa, Bauchi, Borno, Gombe, Taraba, Yobe, Nasarawa, Plateau, Kaduna states and Abuja. Borno state (1,606,406 IDPs) has the highest number of IDPs, followed by Yobe (144,302 IDPs) and Adamawa (135,605 IDPs).
Nigeria — Site Assessment Dashboard 6 (October 2015)
This Site Assessment Dashboard identified 189,011 IDPs (28,983 households) in 76 camps and camp-like settings. 52% of the IDPs identified are children and overall, most IDPs are women between 18 and 59 years old.
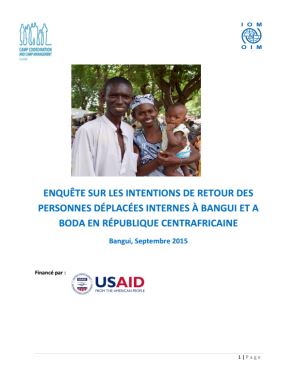
République Centrafricaine — Enquête sur les Intentions de Retour Bangui et Boda (Septembre 2015)
Dans le cadre de la Matrice de Suivi de Déplacement, l'OIM a conduit, du 23 au 31 juillet 2015 une enquête sur les intentions de retour des personnes déplacées à Bangui et à Boda.
Nigeria — Site Assessment Dashboard 5 (August 2015)
As of August 2015, this Site Assessment Dashboard identified 2,150,451 IDPs (300,992 households), of which 170,368 IDPs were staying in 59 camps and camp-like settings. Most IDPs were identified in Borno, Adamawa, Abuja and Yobe.
Nigeria — Displacement Dashboard 5 (July — August 2015)
As of August 2015, 2,150,451 IDPs or300,992 households were identified in the fifth round of assessments. Of these, 170,368 IDPs were identified in 59 camps. The dashboard includes a map of displacement severity by Local Government Area (LGA) and ward.
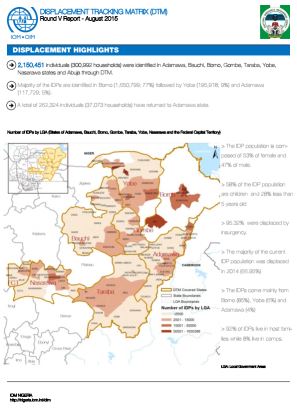
Nigeria — Displacement Report 5 (1 July — 31 August 2015)
2,150,451 IDPs (300,992 households) were identified in Adamawa, Bauchi, Borno, Gombe, Taraba, Yobe, Nasarawa states and Abuja. Borno state (1,650,799 IDPs) has the highest number of IDPs, followed by Yobe (195,918 IDPs) and Adamawa (117,729 IDPs).
Pagination
Pagination
- First page
- Previous page
- 1
- 2
- 3
- 4
- 5
- 6
- 7
- 8
- 9
