-
Countries
-
Data and Analysis
-
Special Focus
-
Crisis Responses
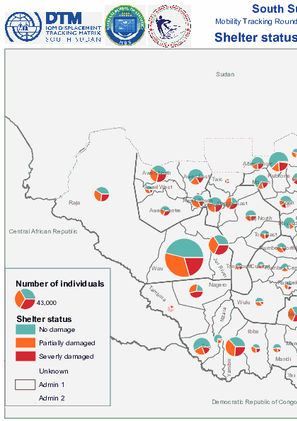
This map displays the shelter status of returnees, as well as their numbers, at the county level (Mobility Tracking Round 11, September 2021).
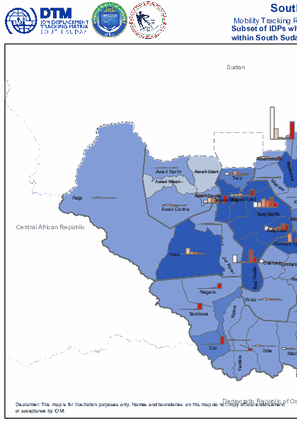
This map displays the subset of IDPs who arrived at their counties from within South Sudan, by period of arrival (Mobility Tracking Round 11, September 2021).
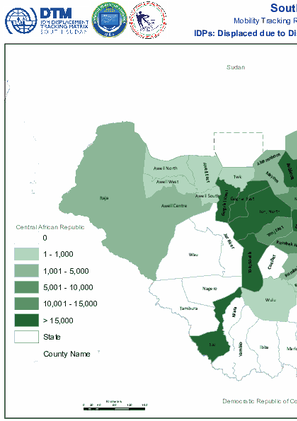
This map displays the numbers of IDPs who have been displaced by natural disasters at the county level (Mobility Tracking Round 11, September 2021).
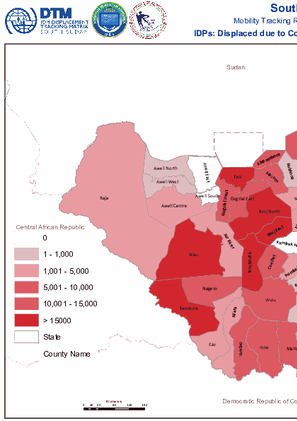
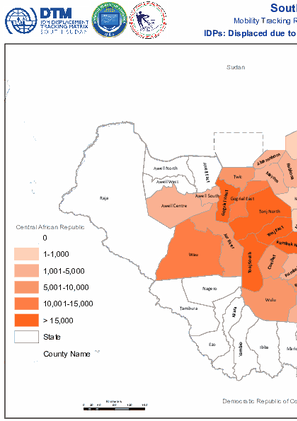
This map displays the numbers of IDPs who have been displaced by conflict at the county level (Mobility Tracking Round 11, September 2021).
This map displays the numbers of IDPs who have been displaced by communal clashes at the county level (Mobility Tracking Round 11, September 2021).
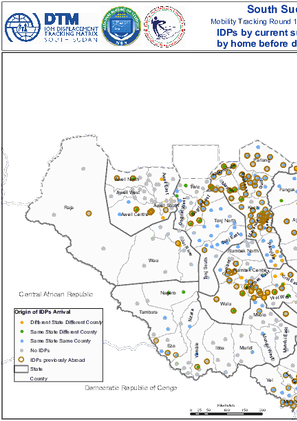
This map shows the payams IDPs are currently in. Where IDPs' origin states and counties are different to those of their currently mapped location, this is indicated (Mobility Tracking Round 11, September 2021).
This map shows the direction of change in the number of IDPs as mapped by round eleven of Mobility Tracking, at the location level (Mobility Tracking Round 11, September 2021).
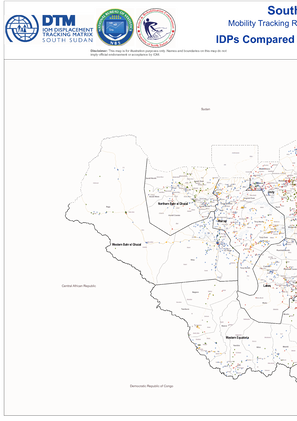
This map compared the locations of IDPs that were mapped during round eleven of Mobility Tracking, as compared to the locations that were mapped in the previous Mobility Tracking Round 10 (Mobility Tracking Round 11, September 2021).
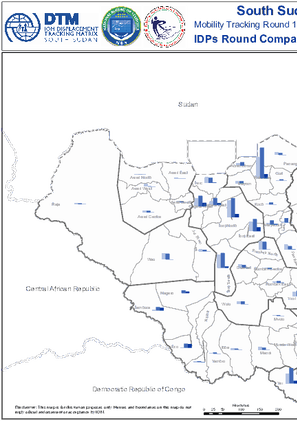
This map compares the number of IDPs as assessed in different rounds of Mobility Tracking, at the county level (Mobility Tracking Round 11, September 2021).
This map displays the subset of IDPs who arrived at their counties in South Sudan from abroad, by period of arrival (Mobility Tracking Round 11, September 2021).
