-
Countries
-
Data and Analysis
-
Special Focus
-
Crisis Responses
IOM works with national and local authorities in order to gain a better understanding of population movements throughout Southern Africa. Through the setup of Flow Monitoring Points (FMPs), IOM seeks to quantify migration flows, trends and routes and to gain a better understanding of the profiles of observed individuals at entry, transit or exit points (such as border crossing posts, bus stations, rest areas, police checkpoints and reception centres). This report is an overview of the data collected in these FMPs from 1 to 31 December 2021.*
Inter-regional migration from and within the Southern Africa is categorized along the following corridors. The Flow Monitoring Points (FMPs) were set-up in several key transit locations along the corridors to track the movements of passengers:
•Zimbabwe (Mutare) – Mozambique (Manica)
•Zimbabwe – Zambia (Chirundu)
•Zimbabwe – Botswana (Plumtree)
•Zimbabwe (Beitbridge) – South Africa
•Malawi (Mchinji) – Zambia (Mwami)
•Malawi (Karonga) – Tanzania
•Malawi (Mwanza) – Mozambique (Zobue)
•Malawi (Mulanje) – Mozambique
During December 2021, a total of 116,051 movements were observed across 44 FMPs in the region.
The Zimbabwe – South Africa corridor hosted the largest number of movements with 90,133 (78%) followed by the Malawi (Mwanza) – Mozambique (Zobue) corridor with 12,033 (10%) and the Malawi – Zambia corridor with 4,569 movements reported (4%).
*Due to operational constraints over the holiday season, enumeration activities were paused on certain days which may not be reflective of flows in each corridor.

Contact
DTMMozambique@iom.int
Language
English
Location
Mozambique
Period Covered
Jan 12 2022
Jan 18 2022
Activity
- Event Tracking
- Mobility Tracking
During the reporting period (12 to 18 January 2022), a total of 52 movements were recorded - 46 Arrivals (2,004 individuals), 3
departures (99 individuals), 2 returns (98 individuals), and 1 Transit (17 individuals). The largest arrival movements were recorded in Nangade (1,248 individuals), Metuge (61 individuals), Chiure (166 individuals) and Cidade de Pemba (152 individuals). The largest departure was observed in Montepuez (283 individuals). The largest return was recorded in Mueda (98 individuals). The largest transit was recorded in Nangade (17 individuals). Of the total population captured by the ETT, 87 per cent were displaced for the first time, and 13 per cent of reported IDPs had been displaced more than once prior to this latest movement.

Contact
DTM Nigeria, AllUsersInDTMNigeria@iom.int
Language
English
Location
Nigeria
Period Covered
Nov 01 2021
Nov 07 2021
Activity
- Event Tracking
- Mobility Tracking
Between 01 and 07 November 2021, a total of 2,734 movements were recorded in the states of Adamawa and Borno. The recorded movements consisted of 2,116 arrivals and 618 departures. Arrivals were recorded at locations in Askira/Uba, Bama, Biu, Gwoza, Hawul, Monguno and Ngala Local Government Areas (LGAs) of the most conflict-affected state of Borno and in Fufore, Girei, Gombi, Hong, Lamurde, Maiha, Michika, Mubi North, Mubi South, Numan, Song, Yola North and Yola South LGAs of Adamawa.
Departures were recorded in Askira/Uba and Kala Balge LGAs of Borno, and Fufore, Gombi, Hong, Lamurde, Maiha, Michika, Mubi North, Mubi South, Numan, Song and Yola South LGAs of Adamawa.
ETT assessments identified the following movement triggers: voluntary relocation (1,364 individuals or 50%), poor living conditions (704 individuals or 26%), improved security (459 individuals or 17%), conflict/attack (128 individuals or 4%) and fear of attack (79 individuals or 3%).

Contact
DTM Nigeria, AllUsersInDTMNigeria@iom.int
Language
English
Location
Nigeria
Period Covered
Oct 25 2021
Oct 31 2021
Activity
- Event Tracking
- Mobility Tracking
Between 25 and 31 October 2021, a total of 2,461 movements were recorded in the states of Adamawa and Borno. The recorded movements consisted of 1,641 arrivals and 820 departures. Arrivals were recorded at locations in Askira/Uba, Bama, Gwoza, Monguno and Ngala Local Government Areas (LGAs) of the most conflict-affected state of Borno and in Fufore, Girei, Gombi, Hong, Lamurde, Maiha, Michika, Mubi North, Song, Yola North, and Yola South LGAs of Adamawa.
Departures were recorded in Askira/Uba, Bama, Gwoza and Kala Balge LGAs of Borno, and Demsa, Fufore, Gombi, Hong, Lamurde, Maiha, Michika, Mubi North, Song, Yola North and Yola South LGAs of Adamawa.
ETT assessments identified the following movement triggers: voluntary relocation (1,164 individuals or 47%), poor living conditions (949 individuals or 39%) and improved security (348 individuals or 14%).

Contact
DTM Nigeria, AllUsersInDTMNigeria@iom.int
Language
English
Location
Nigeria
Period Covered
Oct 18 2021
Oct 24 2021
Activity
- Event Tracking
- Mobility Tracking
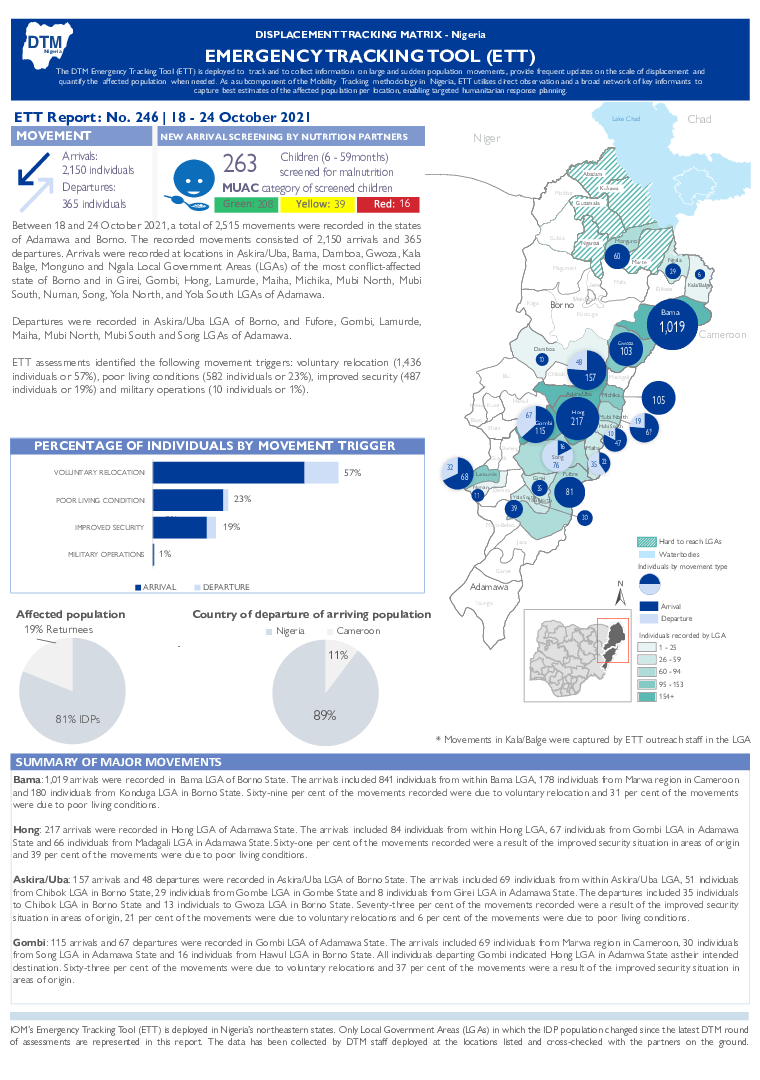
Between 18 and 24 October 2021, a total of 2,515 movements were recorded in the states of Adamawa and Borno. The recorded movements consisted of 2,150 arrivals and 365 departures. Arrivals were recorded at locations in Askira/Uba, Bama, Damboa, Gwoza, Kala Balge, Monguno and Ngala Local Government Areas (LGAs) of the most conflict-affected state of Borno and in Girei, Gombi, Hong, Lamurde, Maiha, Michika, Mubi North, Mubi South, Numan, Song, Yola North, and Yola South LGAs of Adamawa.
Departures were recorded in Askira/Uba LGA of Borno, and Fufore, Gombi, Lamurde, Maiha, Mubi North, Mubi South and Song LGAs of Adamawa.
ETT assessments identified the following movement triggers: voluntary relocation (1,436 individuals or 57%), poor living conditions (582 individuals or 23%), improved security (487 individuals or 19%) and military operations (10 individuals or 1%).

Contact
DTM Nigeria, AllUsersInDTMNigeria@iom.int
Language
English
Location
Nigeria
Period Covered
Oct 11 2021
Oct 17 2021
Activity
- Event Tracking
- Mobility Tracking
Between 11 and 17 October 2021, a total of 3,530 movements were recorded in the states of Adamawa and Borno. The recorded movements consisted of 2,910 arrivals and 620 departures. Arrivals were recorded at locations in Askira/Uba, Bama, Biu, Damboa, Gwoza, Hawul and Ngala Local Government Areas (LGAs) of the most conflict-affected state of Borno and in Fufore, Girei, Gombi, Hong, Lamurde, Maiha, Michika, Mubi North, Mubi South, Numan, Yola North, and Yola South LGAs of Adamawa.
Departures were recorded in Askira/Uba LGA of Borno, and Demsa, Fufore, Girei, Hong, Madagali, Maiha, Mubi North, Mubi South, Song, and Yola South LGAs of Adamawa.
ETT assessments identified the following movement triggers: poor living conditions (1,796 individuals or 51%), voluntary relocation (1,076 individuals or 30%), improved security (364 individuals or 10%), conflict/attack (177 individuals or 5%), seasonal farming (103 individuals or 3%) and military operations (14 individuals or 1%).
Contact
DTM Yemen, iomyemendtm@iom.int
Location
Yemen
Activity
- Event Tracking
- Mobility Tracking
Period Covered
Jan 09 2022 -Jan 15 2022
From 01 January 2022 to 15 January 2022, IOM Yemen DTM estimates that 1,237 households (HH) (7,422 Individuals) have experienced displacement at least once.
Since the beginning of 2022, DTM also identified 004 displaced households who left their locations of displacement and either moved back to their place of origin or another location.
Between 09 and 15 January 2022, IOM Yemen DTM tracked 315 households (1,890 individuals) displaced at least once. The top three governorates and districts where people moved into/within are:
• Al Hodeidah (222 HH) – Hays (210 HH), Al Khukhah (12 HH) districts. Most displacements in the governorate originated from Al Hodeidah and Taiz.
• Marib (39 HH) – Marib City (21 HH), Marib (18 HH) districts. Most displacements in the governorate originated from Al Jawf and Marib.
• Ad Dali (31 HH) – Ad Dali (20 HH), Qatabah (8 HH), Al Hasayn (3 HH) districts. Most displacements in the governorate originated from Ad Dali and Al Hodeidah.
Most displacements resulted from the increased conflict in the following governorates and districts.
• Al Hodeidah (155 HH) – Hays (122 HH), Al Jarrahi (14 HH), Jabal Ras (5 HH) districts.
• Taiz (84 HH) – Maqbanah (82 HH), Al Mawasit (1 HH), Al Qahirah (1 HH) districts.
• Ad Dali (22 HH) – Qatabah (18 HH), Al Husha (3 HH), Damt (1 HH) districts.
Population Groups
Survey Methodology
Unit of Analysis Or Observation
Type of Survey or Assessment
Keywords
Geographical Scope
Administrative boundaries with available data
The current dataset covers the following administrative boundaries

Contact
DTM Yemen, iomyemendtm@iom.int
Language
English
Location
Yemen
Period Covered
Jan 09 2022
Jan 15 2022
Activity
- Rapid Emergency Registration
- Mobility Tracking
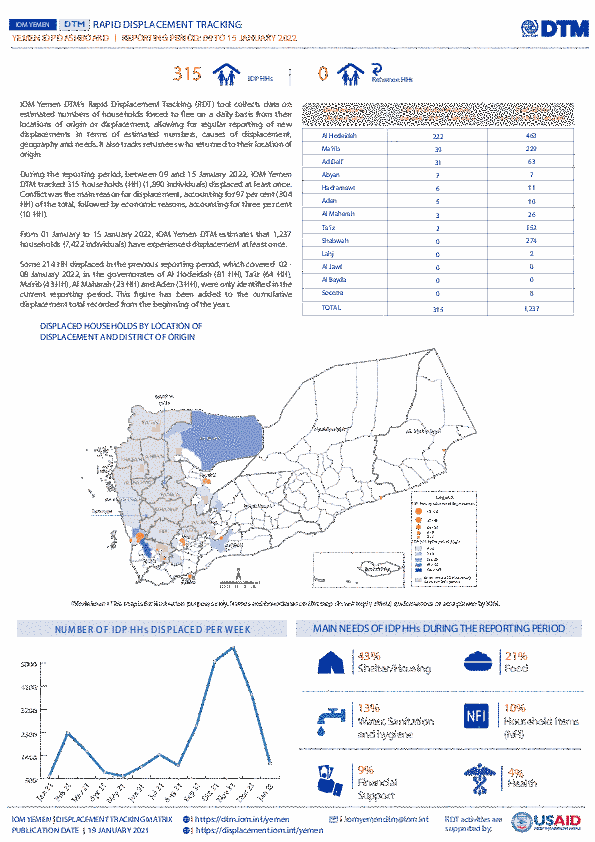
IOM Yemen DTM’s Rapid Displacement Tracking (RDT) tool collects data on estimated numbers of households forced to flee on a daily basis from their locations of origin or displacement, allowing for regular reporting of new displacements in terms of estimated numbers, geography, and needs. It also tracks Returnees who returned to their location of origin.
From 01 January 2022 to 15 January 2022, IOM Yemen DTM estimates that 1,237 households (HH) (7,422 Individuals) have experienced displacement at least once.
Since the beginning of 2022, DTM also identified 004 displaced households who left their locations of displacement and either moved back to their place of origin or another location.
Between 09 and 15 January 2022, IOM Yemen DTM tracked 315 households (1,890 individuals) displaced at least once. The top three governorates and districts where people moved into/within are:
- Al Hodeidah (222 HH) – Hays (210 HH), Al Khukhah (12 HH) districts. Most displacements in the governorate originated from Al Hodeidah and Taiz.
- Marib (39 HH) – Marib City (21 HH), Marib (18 HH) districts. Most displacements in the governorate originated from Al Jawf and Marib.
- Ad Dali (31 HH) – Ad Dali (20 HH), Qatabah (8 HH), Al Hasayn (3 HH) districts. Most displacements in the governorate originated from Ad Dali and Al Hodeidah.
Most displacements resulted from the increased conflict in the following governorates and districts.
- Al Hodeidah (155 HH) – Hays (122 HH), Al Jarrahi (14 HH), Jabal Ras (5 HH) districts.
- Taiz (84 HH) – Maqbanah (82 HH), Al Mawasit (1 HH), Al Qahirah (1 HH) districts.
- Ad Dali (22 HH) – Qatabah (18 HH), Al Husha (3 HH), Damt (1 HH) districts.

Contact
DTM Sudan; dtmsudan@iom.int
Language
English
Location
Sudan
Snapshot Date
Jan 12 2022
Activity
- Mobility Tracking
- Event Tracking
The DTM Emergency Event Tracking (EET) is deployed to track sudden displacement and population movements, provide more frequent updates on the scale of displacement, and quantify the affected population when needed. As a subcomponent of the new Mobility Tracking methodology in Sudan (Round Three), and activated on a need basis, EET utilises a broad network of key informants to capture best estimates of the affected population presence per location – a useful tool for humanitarian response planning and design.

Contact
DTM Support — iomdrcdtm@iom.int
Language
French
Location
Democratic Republic of the Congo
Period Covered
Aug 03 2021
Aug 23 2021
Activity
- Event Tracking
- Mobility Tracking
- Baseline Assessment
Au cours de ce sixième cycle d’évaluation couvrant le mois d’août 2021, les évaluations DTM ont permis de dénombrer 1 479 709 Personnes Déplacées Internes (PDIs) résidant dans des familles d’accueil (84% du total) et 81 447 personnes déplacées vivant dans 43 sites spontanés et centres collectifs1 dans la province (4% du total) (F5B). À cela s’ajoutent les 203 938 PDIs (12%) dans les 50 sites couverts par le mécanisme CCCM2 . Il est estimé à 1.765.094 personnes le nombre total de PDIs dans la province, soit environ 31% de la population3 totale de l’Ituri. Ce qui est comparable aux 1 706 705 personnes en situation de déplacement lors de la dernière évaluation conduite en avril 2021.

