Nov 30 2021
- Flow Monitoring
- Mobility Tracking
- Baseline Assessment
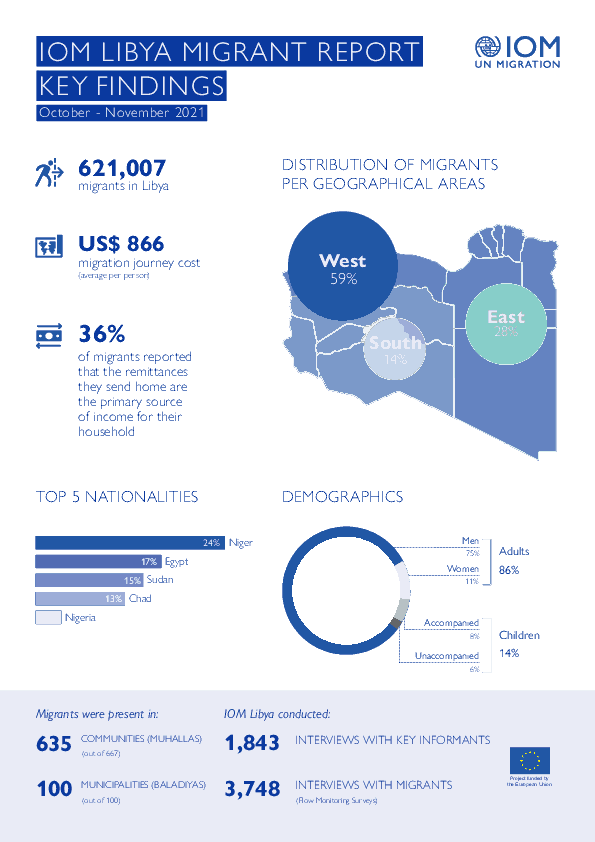
This infographic presents the key findings of Round 39 of the mobility tracking component of the Displacement Tracking Matrix (DTM) programme in Libya.

Nov 30 2021
- Mobility Tracking
- Baseline Assessment
DTM Libya identified a total of 621,007 migrants from over 43 nationalities in the 100 Libyan municipalities during Round 39 of data collection (October – November 2021). In line with a trend which started at the beginning of 2021, the number of migrants in Libya has continued to increase during the months of October and November while remaining slightly lower than in 2019 for the corresponding reporting period (654,081 migrants during Round 28). In 2020, the migrant population in Libya decreased following the start of the COVID-19 pandemic and the subsequent economic downturn as well as tightened security controls and mobility restrictions.
Dec 31 2021
- Site Assessment
- Mobility Tracking
- Baseline Assessment
- Village Assessment
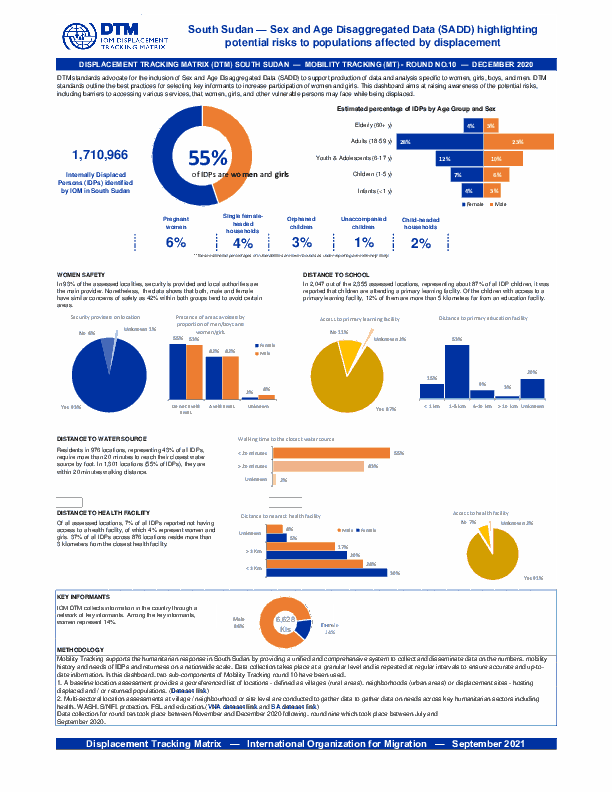
DTM standards advocate for the inclusion of Sex and Age Disaggregated Data (SADD) to support production of data and analysis specific to women, girls, boys, and men. DTM standards outline the best practices for selecting key informants to increase participation of women and girls. This dashboard aims at raising awareness of the potential risks, including barriers to accessing various services, that women, girls, and other vulnerable persons may face while being displaced.
The current outbreak of COVID-19 has affected global mobility in complex and unprecedented ways in the form of various travel restrictions, suspension of air travel, and border closures. To better understand this, the International Organization for Migration (IOM) has developed a global mobility database to map these impacts on human mobility, across global, regional, and country levels. Furthermore, COVID-19 has had a disproportionate impact on vulnerable populations in camps and camp-like settings as well as exacerbated the vulnerabilities of mobile populations who may now be stranded owing to COVID-19 related mobility restrictions. This data is particularly important when addressing specific needs faced by migrants and mobile populations.
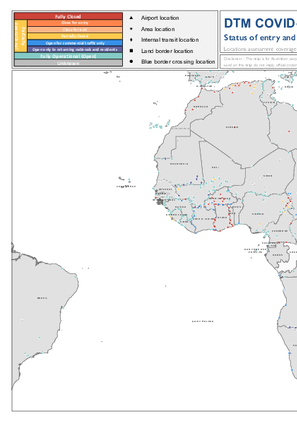
IOM has developed a global mobility database mapping the status of different Points of Entry (PoE) and Key Locations of Internal Mobility, globally. These include airports, land border crossing points (could be rail or road), blue border crossing points (sea, river or lake), internal transit points, and areas of interest. For each point of entry, data is collected on the type of restriction, measured applied, and the timeframe, as well as the population category that may be affected by the restrictive measures. This workstream uses direct input from IOM missions and this dashboard displays regularly updated mobility restrictions at the location level.
Dec 31 2021
- Mobility Tracking
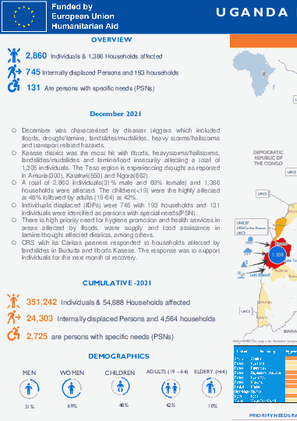
December was characterized by disaster triggers which included floods, drought/famine, landslides/mudslides, heavy storms/hailstorms and transport related hazards.
Kasese district was the most hit with floods, heavystorms/hailstorms, landslides/mudslides and famine/food insecurity affecting a total of 1,305 individuals. The Teso region is experiencing drought as reported in Amuria(300), Katakwi(550) and Ngora(662).
A total of 2,860 individuals(31% male and 69% female) and 1,386 households were affected. The children(<19) were the highly affected at 48% followed by adults (19-64) at 42%.
Individuals displaced (IDPs) were 745 with 193 households and 131 individuals were identified as persons with special needs(PSN).
There is high priority need for hygiene promotion and health services in areas affected by floods, water supply and food assistance in famine/drought affected districts, among others.
CRS with its Caritas partners responded to households affected by landslides in Bududa and floods Kasese. The response was to support individuals for the next month of recovery.

Jan 08 2022
- Rapid Emergency Registration
- Mobility Tracking
IOM Yemen DTM’s Rapid Displacement Tracking (RDT) tool collects data on estimated numbers of households forced to flee on a daily basis from their locations of origin or displacement, allowing for regular reporting of new displacements in terms of estimated numbers, geography, and needs. It also tracks Returnees who returned to their location of origin.
From 01 January 2022 to 8 January 2022, IOM Yemen DTM estimates that 708 households (HH) (4,248 Individuals) have experienced displacement at least once.
Since the beginning of 2022, DTM also identified no displaced households who left their locations of displacement and either moved back to their place of origin or another location.
Between 02 and 08 January 2022, IOM Yemen DTM tracked 578 households (3,468 individuals) displaced at least once. The top three governorates and districts where people moved into/within are:
- Shabwah (274 HH) – Osaylan (231 HH), Bayhan (37 HH), Markhah Al Olya (6 HH) districts. All displacements in the governorate were internal.
- Al Hodeidah (136 HH) – Hays (115 HH), Al Khukhah (21 HH) districts. Most displacements in the governorate originated from Al Hodeidah and Taiz.
- Marib (99 HH) – Marib City (79 HH), Marib (20 HH) districts. Most displacements in the governorate originated from Al Jawf.
Most displacements resulted from the increased conflict in the following governorates and districts.
- Shabwah (276 HH) – Osaylan (232 HH), Bayhan (38 HH), Markhah Al Olya (6 HH) districts.
- Al Hodeidah (119 HH) – Hays (74 HH), Jabal Ras (20 HH), At Tuhayta (11 HH) districts.
- Al Jawf (81 HH) – Khab wa Ash Shaf (81 HH) district.
Nov 30 2021
- Flow Monitoring Survey
- Flow Monitoring
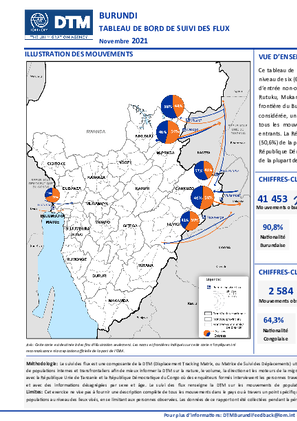
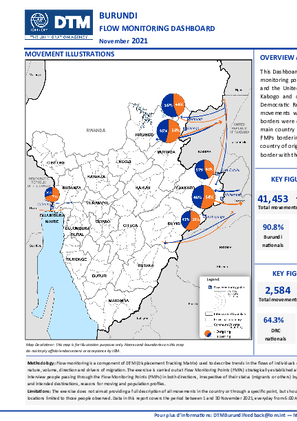
Ce tableau de bord fournit une analyse des tendances de la mobilité des populations observées au niveau de six (6) points de suivi des flux (Flow Monitoring Points, FMP), cinq (5) établis sur des points d’entrée non-officiels établis entre la frontière du Burundi et la République Unie de Tanzanie à Kwa Rutuku, Mukambati, Mbundi, Kabuyenge et Kabogo et un (1) point d’entrée officiel situé entre la frontière du Burundi et de la République Démocratique du Congo à Gatumba. Au cours de la période considérée, un total de 44 037 mouvements ont été observés à ces points. Environ 51,7 pour cent de tous les mouvements au niveau des deux frontières étaient sortants et 48,3 pour cent étaient entrants. La République Unie de Tanzanie était le principal pays d’origine (49,4%) et de destination (50,6%) de la plupart des mouvements suivis à travers les FMPs frontaliers avec ce pays. De même, la République Démocratique du Congo était le principal pays d’origine (30,0%) et de destination (70,0%) de la plupart des mouvements suivis à travers le FMP frontalier avec ce pays.
Nov 30 2021
- Flow Monitoring Survey
- Flow Monitoring
This Dashboard provides an analysis of the trends in population mobility observed at six (6) flow monitoring points (FMPs), five (5) established at unofficial border crossing points between Burundi and the United Republic of Tanzania border at Kwa Rutuku, Mukambati, Mbundi, Kabuyenge and Kabogo and one (1) established at official border crossing point, between Burundi and the Democratic Republic of the Congo at Gatumba. Over the reporting period, a total of 44,037 movements were observed at these points. About 51.7 per cent of all movements at the two borders were outgoing and 48.3 per cent were incoming. The United Republic of Tanzania was the main country of origin (49.4%) and destination (50.6%) for the movements followed through the FMPs bordering this country. Similarly, the Democratic Republic of the Congo was also the main country of origin (30.0%) and destination (70.0%) for movements followed through the FMP at the border with the same country.
- Flow Monitoring
- Migrants presence
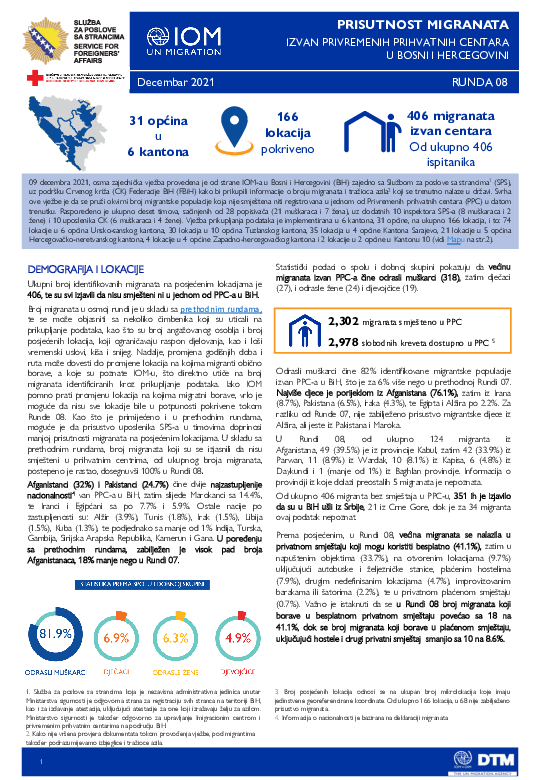
09 decembra 2021, osma zajednička vježba provedena je od strane IOM-a u Bosni i Hercegovini (BiH) zajedno sa Službom za poslove sa strancima1 (SPS), uz podršku Crvenog križa (CK) Federacije BiH (FBiH) kako bi prikupili informacije o broju migranata i tražioca azila2 koji se trenutno nalaze u državi. Svrha ove vježbe je da se pruži okvirni broj migrantske populacije koja nije smještena niti registrovana u jednom od Privremenih prihvatnih centara (PPC) u datom trenutku. Raspoređeno je ukupno deset timova, sačinjenih od 28 popisivača (21 muškaraca i 7 žena), uz dodatnih 10 inspektora SPS-a (8 muškaraca i 2
žene) i 10 uposlenika CK (6 muškaraca i 4 žene). Vježba prikupljanja podataka je implementirana u 6 kantona, 31 općine, na ukupno 166 lokacija, i to: 74 lokacije u 6 općina Unsko-sanskog kantona, 30 lokacija u 10 općina Tuzlanskog kantona, 35 lokacija u 4 općine Kantona Sarajevo, 21 lokacije u 5 općina Hercegovačko-neretvanskog kantona, 4 lokacije u 4 općine Zapadno-hercegovačkog kantona i 2 lokacije u 2 općine u Kantonu 10.
- Flow Monitoring
- Migrants presence
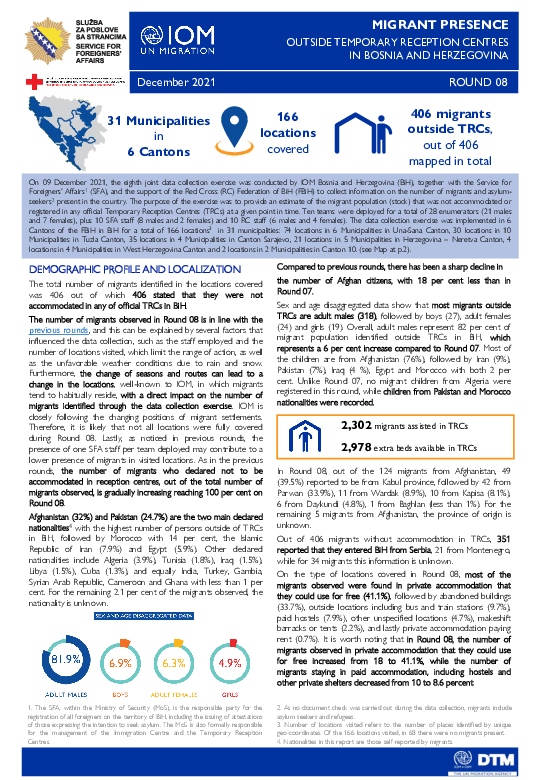
On 09 December 2021, the eighth joint data collection exercise was conducted by IOM Bosnia and Herzegovina (BiH), together with the Service for Foreigners’ Affairs (SFA), and the support of the Red Cross (RC) Federation of BiH (FBiH) to collect information on the number of migrants and asylum seekers present in the country. The purpose of the exercise was to provide an estimate of the migrant population (stock) that was not accommodated or registered in any official Temporary Reception Centres (TRCs) at a given point in time. Ten teams were deployed for a total of 28 enumerators (21 males and 7 females), plus 10 SFA staff (8 males and 2 females) and 10 RC staff (6 males and 4 females). The data collection exercise was implemented in 6 Cantons of the FBiH in BiH for a total of 166 locations3 in 31 municipalities: 74 locations in 6 Municipalities in Una-Sana Canton, 30 locations in 10 Municipalities in Tuzla Canton, 35 locations in 4 Municipalities in Canton Sarajevo, 21 locations in 5 Municipalities in Herzegovina – Neretva Canton, 4 locations in 4 Municipalities in West Herzegovina Canton and 2 locations in 2 Municipalities in Canton 10.

DTM Global Survey 2023
The Displacement Tracking Matrix (DTM) Global Survey 2023 is an annual stocktaking exercise which aims to present IOM DTM's operations and activities transparently. The Global Survey focuses on operations active from January 1 to December 31, 2023, with data collection occurring from February to April 2024.