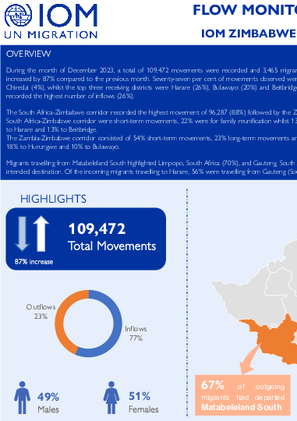
During the month of December 2023, a total of 109,472 movements were recorded and 3,465 migrants were interviewed across 38 Flow Monitoring Points (FMPs) in Zimbabwe. The total movements recorded increased by 87% compared to the previous month. Seventy-seven per cent of movements observed were inflows, whilst 23% were outflows. The top three sending districts were Beitbridge (64%), Harare (12%) and Chiredzi (4%), whilst the top three receiving districts were Harare (26%), Bulawayo (20%) and Beitbridge (11%). Matabeleland South province recorded the highest number of outflows (67%) whilst Harare province recorded the highest number of inflows (26%). The South Africa-Zimbabwe corridor recorded the highest movement of 96,287 (88%) followed by the Zambia-Zimbabwe corridor which recorded 8,588 (8%) movements. Sixty-two per cent of movements along the South Africa-Zimbabwe corridor were short-term movements, 22% were for family reunification whilst 13% were long-term movements. Of the migrants travelling from South Africa, 22% were going to Bulawayo, 22% to Harare and 13% to Beitbridge. The Zambia-Zimbabwe corridor consisted of 54% short-term movements, 23% long-term movements and 21% family reunification movements. Of the migrants travelling from Zambia, 55% were travelling to Harare, 18% to Hurungwe and 10% to Bulawayo. Migrants travelling from Matabeleland South highlighted Limpopo, South Africa (70%), and Gauteng, South Africa (18%) as their intended destination. Those travelling to Botswana indicated Central Province (4%) as their intended destination. Of the incoming migrants travelling to Harare, 56% were travelling from Gauteng (South Africa), 24% from Lusaka (Zambia), and 5% from Western Cape (South Africa).

Nov 30 2023
- Flow Monitoring
During the month of November 2023, a total of 58,669 movements were recorded and 3,679 migrants were interviewed across 38 Flow Monitoring Points (FMPs) in Zimbabwe. The total movements recorded increased by 0.2% compared to the previous month. Sixty-eight per cent of movements observed were inflows, whilst 32% were outflows. The top three sending districts were Beitbridge (47%), Harare (16%) and Chiredzi (7%), whilst the top three receiving districts were Harare (30%), Beitbridge (12%) and Bulawayo (10%). Matabeleland South province recorded the highest number of outflows (52%) whilst Harare province recorded the highest number of inflows (31%). The South Africa-Zimbabwe corridor recorded the highest movement of 46,911 (80%) followed by the Zambia-Zimbabwe corridor which recorded 7,272 (12%) movements. Fifty-nine per cent of movements along the South Africa-Zimbabwe corridor were short-term movements, 20% were for family reunification whilst 20% were long-term economic movements. Of the migrants travelling from South Africa, 25% were going to Harare, 15% to Beitbridge and 9% to Bulawayo. The Zambia-Zimbabwe corridor consisted of 53% short-term movements, 24% family reunification movements and 22% long-term movements. Of the migrants travelling from Zambia, 54% were travelling to Harare, 15% to Bulawayo and 13% to Hurungwe. Migrants travelling from Matabeleland South highlighted Limpopo, South Africa (69%), and Gauteng, South Africa (19%) as their intended destination. Those travelling to Botswana indicated Central Province (3%) as their intended destination. Of the incoming migrants travelling to Harare, 35% were travelling from Gauteng (South Africa), 30% from Lusaka (Zambia), and 13% from Eastern Cape (South Africa).

Jan 31 2024
- Flow Monitoring
En el mes de enero de 2024, el contexto en las fronteras de Tumbes, Tacna y Desaguadero estuvo caracterizado por diversos acontecimientos. En Tumbes, la provincia de Zarumilla ha continuado en Estado de Emergencia por noveno mes, con una extensión de 60 días, a fin de controlar el orden interno y mitigar la migración irregular. En Tacna, continúa en evaluación el plan piloto de accesibilidad de transporte colectivo en la ruta Tacna-Arica, para mejorar y garantizar un paso fronterizo ágil y seguro. En Puno, se registró una disminución de los flujos debido al bloqueo de carreteras que conectan con el Estado Plurinacional de Bolivia (en adelante, Bolivia) y Chile, dado la tensión política que vive Bolivia. Estos bloqueos han generado nuevas rutas para las personas en tránsito, una de ellas es por Assis (Brasil) - Madre de Dios (Perú).
Dec 31 2023
- Survey
- Flow Monitoring Survey
- Mobility Tracking
- Baseline Assessment
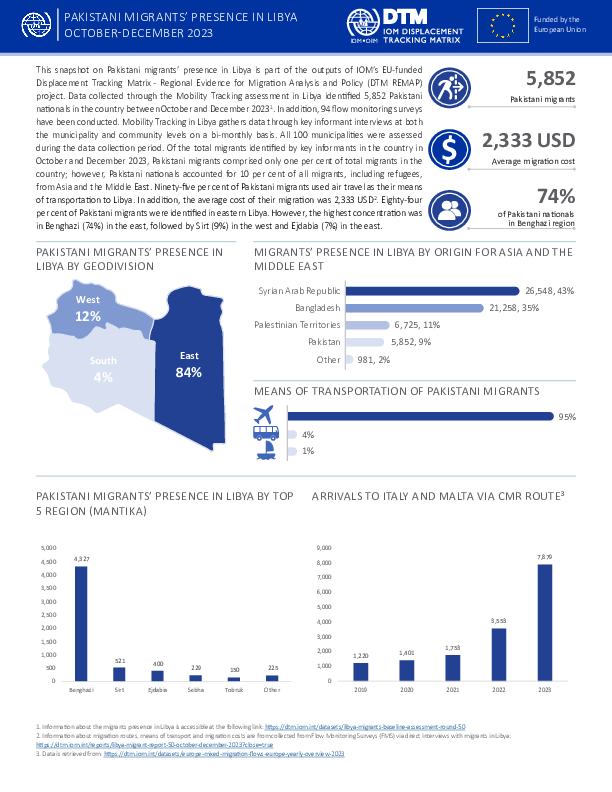
This snapshot on Pakistani migrants’ presence in Libya is part of the outputs of IOM’s EU-funded Displacement Tracking Matrix - Regional Evidence for Migration Analysis and Policy (DTM REMAP) project. Data collected through the Mobility Tracking assessment in Libya identified 5,852 Pakistani nationals in the country between October and December 20231. In addition, 94 flow monitoring surveys have been conducted. Mobility Tracking in Libya gathers data through key informant interviews at both the municipality and community levels on a bi-monthly basis. All 100 municipalities were assessed during the data collection period. Of the total migrants identified by key informants in the country in October and December 2023, Pakistani migrants comprised only one per cent of total migrants in the country; however, Pakistani nationals accounted for 10 per cent of all migrants, including refugees, from Asia and the Middle East. Ninety-five per cent of Pakistani migrants used air travel as their means of transportation to Libya. In addition, the average cost of their migration was 2,333 USD2. Eighty-four per cent of Pakistani migrants were identified in eastern Libya. However, the highest concentration was in Benghazi (74%) in the east, followed by Sirt (9%) in the west and Ejdabia (7%) in the east.

This report provides insights into the profiles, experiences, needs, routes travelled and intentions of migrants transiting through the Western Balkans.
IOM surveyed 1,484 migrants from 1 March to 31 March 2024 in Albania, Bosnia and Herzegovina, Montenegro, North Macedonia, Serbia and Kosovo*.
* References to Kosovo* shall be understood in the context of UN Security Council Resolution 1244 (1999).
Dec 27 2023
- Other
Since the full-scale invasion of Ukraine in February 2022, the country has confronted profound economic disruptions alongside widespread displacement. With millions seeking safety and stability, the challenges of maintaining livelihoods, securing employment, and accessing social protection are paramount, necessitating focused interventions to mitigate economic hardships.
This report examines the economic ramifications of the war in Ukraine, focusing on changes in income levels, employment trends, and social assistance measures. Drawing on data from the IOM General Population Survey (GPS), this report aims to support evidence-based programming, policy-making, advocacy, and further research on the subject.
- Mobility Tracking
Mar 31 2024
IOM's Data and Analytics (D&A) Unit developed the Mobility and Needs Assessment (MaNA), a monthly, multi-sectoral assessment designed to systematically monitor the estimated current presence of key population groups, including de facto Internally Displaced Persons (IDPs), returnees and non-displaced residents, at the hromada level. MaNA also offers a regular baseline for evaluating population needs at a granular level, with a specific focus on hard-to-reach areas. It utilizes sector specific indicators, serving as a compass to steer humanitarian programming and response efforts.
This dataset presents the primary findings from the seventh round of MaNA, conducted in March 2024 across 255 hromadas located in 23 oblasts and Kyiv City. Assessed hromadas were selected based on their relevance to humanitarian programming, pre-war population size, and known displacement trends.
This is a restricted dataset. To get access, kindly click on the 'Request Access' button.
Population Groups
IDPs
Residents
Returnee (Previously Internally Displaced)
Survey Methodology
Unit of Analysis Or Observation
Admin Area 2
Admin Area 3
Site or Location
Type of Survey or Assessment
Key Informant
Keywords
Geographical Scope Partial Coverage
Administrative boundaries with available data
The current dataset covers the following administrative boundaries
- Survey
- Flow Monitoring Survey
- Return Intention
- Flow Monitoring
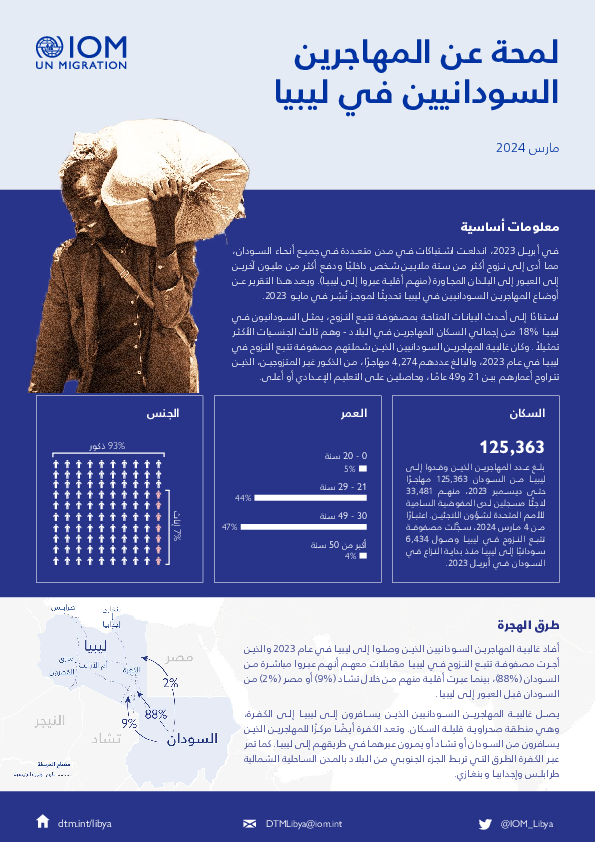
يقدم هذا الملف معلومات عن وضع المهاجرين السودانيين في ليبيا ونقاط ضعفهم، بما في ذلك أولئك الذين وصلوا بعد بداية النزاع في منتصف أبريل 2023، ويقدم تحديثًا لموجز نُشر في مايو 2023.
تستند المعلومات المتعلقة بوضع المهاجرين ونقاط الضعف إلى مقابلات فردية كمية أجرتها مصفوفة تتبع النزوح في ليبيا مع 4,274 مهاجرًا في عام 2023، ما لم يُنص على خلاف ذلك. تستند أرقام المهاجرين إلى البيانات التي تم جمعها من خلال مقابلات مع مزودي المعلومات.

Apr 26 2024
- Mobility Tracking
- Event Tracking
Between 17 to 26 April 2024, sporadic attacks, and fear of attacks by Non-state Armed Groups in Ancuabe and Chiúre triggered the cumulative displacement of 19,208 individuals/4,448 families. The current Movement Alert #106 reports on most recent attacks in southern Cabo Delgado. For more information on displacements between February and March, please see {Emergency Tracking Online Dashboard}.
- Mobility Tracking
- Event Tracking
Apr 27 2024
From 1 January to 27 April 2024, IOM Yemen DTM tracked 1,067 households (HH) (6,402 Individuals) who experienced displacement at least once.
Between 21 and 27 April 2024, IOM Yemen DTM tracked 39 households (234 individuals) displaced at least once. The majority of people moved into/within the following governorates and districts:
- Ma’rib (34 HHs) – Ma’rib (21 HH), Ma’rib City (11 HH), Harib (2 HHs) districts. Most displacements in the governorate originated from Ma’rib and Al Hodeidah.
- Ta’iz (5 HHs) – Jabal Habashi (4 HHs), As Silw (1 HH) districts. Most displacements in the governorate were internal.
The majority of people moved from the following governorates and districts:
- Ma’rib (8 HHs) – Al Jubah (2 HHs), Majzar (2 HHs), Bidbadah (1 HH) districts.
- Ta’iz (7 HH) – Maqbanah (4 HHs), Al Misrakh (1 HH), Al Qahirah (1 HH) districts.
- Al Hodeidah (5 HH) – Bayt Al Faqih (1 HH), Al Mansuriyah (1 HH), As Salif (1 HH) districts.
Population Groups
Survey Methodology
Unit of Analysis Or Observation
Type of Survey or Assessment
Keywords
Geographical Scope
Administrative boundaries with available data
The current dataset covers the following administrative boundaries

DTM Global Survey 2023
The Displacement Tracking Matrix (DTM) Global Survey 2023 is an annual stocktaking exercise which aims to present IOM DTM's operations and activities transparently. The Global Survey focuses on operations active from January 1 to December 31, 2023, with data collection occurring from February to April 2024.