Baseline 2, an area-based assessment, is the second step of Mobility Tracking implemented at settlement level and aims to quantify presence of population categories. For round 3, DTM Somalia is administered across 7 regions and 29 districts in three states namely Hirshabelle, Jubaland, South-West State from February to March 2024.
Baseline 2, an area-based assessment, is the second step of Mobility Tracking implemented at settlement level and aims to quantify presence of population categories. For round 3, DTM Somalia is administered across 7 regions and 29 districts in three states namely Hirshabelle, Jubaland, South-West State from February to March 2024.
Baseline 2, an area-based assessment, is the second step of Mobility Tracking implemented at settlement level and aims to quantify presence of population categories. For round 3, DTM Somalia is administered across 7 regions and 29 districts in three states namely Hirshabelle, Jubaland, South-West State from February to March 2024.
Baseline 2, an area-based assessment, is the second step of Mobility Tracking implemented at settlement level and aims to quantify presence of population categories. For round 3, DTM Somalia is administered across 7 regions and 29 districts in three states namely Hirshabelle, Jubaland, South-West State from February to March 2024.
May 31 2024
- Survey
- Flow Monitoring Survey
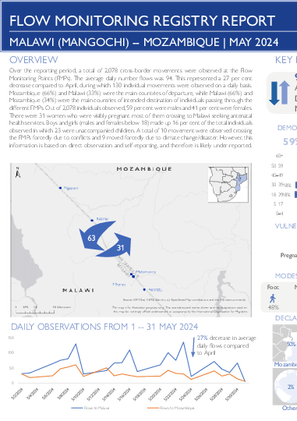
This report is an overview of the data collected from 1 to 31 May 2024 at Mangochi FMP in Malawi along the border with Mozambique and Karonga FMP in Malawi along the border with the United Republic of Tanzania. The Flow Monitoring Registry (FMR) collects data at Flow Monitoring Points (FMPs) through direct observation and interviews with key informants, including staff working at transit stations, border patrol officers, local authorities, bus or taxi drivers and travellers themselves. The FMR gathers data on the number of travellers crossing FMPs, as well as the provenance, next destination, vulnerabilities and means of transport of travellers.
Baseline 2, an area-based assessment, is the second step of Mobility Tracking implemented at settlement level and aims to quantify presence of population categories. For round 3, DTM Somalia is administered across 7 regions and 29 districts in three states namely Hirshabelle, Jubaland, South-West State from February to March 2024.

Jul 29 2024
- Flow Monitoring
This fact sheet provides a bi-weekly update on migration-related events off the Libyan coast. During the reporting period, 226 migrants were intercepted and returned to Libya during the reporting period.

Jun 02 2024
- Mobility Tracking
- Event Tracking
Du 1er au 2 juin, la situation sécuritaire et de santé dans la region s’est détériorée suite aux attaques des ADF dans les environs de l’agglomération de Cantine dans le groupement d’Aloya Mambembe du territoire de Beni. Les populations des villages du groupement de Mambembe ont été contraints aux déplacements préventifs vers les villages dans l’aire de santé d’Aloya. Ces ménages déplacés ont été reçus dans les familles d’accueil. Les besoins humanitaires sont considérables dans l'ensemble des zones touchées. De plus, en date du 4 avril 2024, une forte pluie accompagnée de vents violents a eu des répercussions sur l’aire de santé d’Aloya, dans la zone de santé de Mabalako. Plusieurs toitures des maisons et écoles emportées (cinq salles de classe de l’Institut Madiwe, 18 maisons d’habitation au quartier Mavwe), et l’enclos du stade de football Kayindondya ont été impactés. Cette situation a contraint les 18 ménages touchés à trouver refuge dans les villages et les ménages de proximité.

Jun 04 2024
- Mobility Tracking
- Event Tracking
Depuis le début du mois d’avril 2024, la zone de santé Mabalako a été cible des attaques du groupe armé ADF (Forces Démocratiques Alliées). Plusieurs pertes en vies humaines et des dégâts multiples ont été enregistrés. Dans la soirée du 18 avril 2024, il y avait des nouvelles attaques des ADF sur la population de l’aire de santé Linzo. La communauté hôte et les personnes déplacées, qui étaient venues de l’aire de santé Mangodomu et de Kudukudu dans la zone de santé de Mabalako et qui sont déjà installées dans l’aire de santé de Linzo, ont été contraint de se déplacer vers les villages considérés plus en sécurité dans l’aire de santé Buhumbani, dans les villages Kyanzaba et Bingo à Mangada.
Ce type de violence récurrente dans la zone ont conduit à la dégradation de la situation sécuritaire, d’accès des acteurs humanitaires dans plusieurs localités, et la détérioration des moyens de subsistance. Cela a aggravé les conséquences humanitaires pour de nombreuses personnes vulnérables et des populations en déplacement préventif et secondaire en besoins fondamentaux dans la zone de santé de Mabalako.

DTM API
Making global IDPs data accessible and reliable
The Displacement Tracking Matrix application programming interface (API) accelerates secure sharing of IDPs’ data, simplifying access to data across users and partners to support action, insight and foresight.