- Mobility Tracking
- Baseline Assessment
Jul 31 2023
Population Groups
Survey Methodology
Unit of Analysis Or Observation
Type of Survey or Assessment
Keywords
Geographical Scope
Administrative boundaries with available data
The current dataset covers the following administrative boundaries

Centroamérica, Norteamérica y el Caribe, es una región de donde surgen y fluyen grandes movimientos migratorios. Según datos de migración de Panamá, de enero a junio de 2023 al menos 196.371 personas migrantes ingresaron a Panamá por la ruta del Darién. En el mismo período de 2022, ingresaron 49.452 personas, representando un aumento del 297 por ciento. De enero a junio 2023, se han recopilado datos primarios en cerca de 100 localidades de la Región con la Matriz de Seguimiento de Desplazamiento (DTM por sus siglas en inglés). A junio 2023, se publicaron reportes DTM en siete países, de componentes seguimiento a la movilidad, monitoreo de flujos y encuestas, que cuentan los movimientos registrados y los desplazados internos, encuestas a personas en movilidad y retornados.
Este informe tiene como objetivo ofrecer un panorama general de los movimientos migratorios en la región, las localidades y los meses en los que se recopilaron los datos primarios a través de instrumentos de DTM, así como realizar un análisis exploratorio de los perfiles sociodemográficos, las necesidades e intenciones de los migrantes entrevistados en las encuestas de monitoreo de flujos, según su nacionalidad.
- Mobility Tracking
- Baseline Assessment
Aug 20 2023
Population Groups
Survey Methodology
Unit of Analysis Or Observation
Type of Survey or Assessment
Keywords
Geographical Scope
Administrative boundaries with available data
The current dataset covers the following administrative boundaries

Jun 30 2023
- Survey
- Flow Monitoring
This report is based on a survey of displacement patterns, needs and intentions conducted by IOM’s Displacement Tracking Matrix (DTM) in the countries included in the Regional Response Plan for Ukraine in 2023: 6 countries neighbouring Ukraine – Belarus, Hungary, Poland, Republic of Moldova, Romania and Slovakia – and other 5 countries particularly impacted by the arrivals of refugees from Ukraine since the start of the war in February 2022 – Bulgaria, Czechia, Estonia, Latvia and Lithuania. The analysis presented in this report is based on data collected between April and June 2023.
Key Findings:
• Top oblasts of origin: Donetska (25%), Khersonska (21%), Zaporizka (17%) and Luhanska (13%).
• Intentions to move: Latvia is a transit country for many refugees from Ukraine. The majority planned to move to another country (58%), where Top 3 were Poland, Russian Federation and Germany. Others wanted to move to a different location in Ukraine (29%) or move to their place of origin in Ukraine (8%).
• Employment status: unemployed and looking for a job (40%), employed (20%), retired (25%), unemployed and not looking for a job (4%), daily worker (3%).
• Top needs:* housing (36%), cash support (36%), employment (34%), medical needs (23%), information (18%).
• Top areas of assistance received:* food products (74%), financial support (40%), housing (35%), personal hygiene and sanitary supplies (16%).
* more than one answer possible
The development and implementation of policies and programmes in West and Central Africa promoting safe, orderly and humane migration require a better understanding of human mobility in the region.
Human mobility in the region take many different forms. Transhumance, seasonal migration conducted during the harvesting season, travel during religious festivities, tourism, economic migration to North Africa and Europe, the search for employment in the mining industry, forced displacements due to conflict, natural disasters or climate-related migration, rural exodus, are all examples of movements observes in West and Central Africa and show the many faceted nature of mobility in the region.
This document is an attempt to provide a dynamic and regularly updated portrait of mobility within, from and to West and Central Africa regionon for Migration (IOM), the United Nations Department of Economic and Social Affairs (UNDESA) and the United Nations High Commissioner for Refugees (UNHCR).
The maps contained in this document are not only meant to inform on ongoing mobility patterns, but also provide information to support direct programming (protection of migrants, management of transhumance flows, support to safe returns of displaced people) and policy.
- Mobility Tracking
- Baseline Assessment
Overview
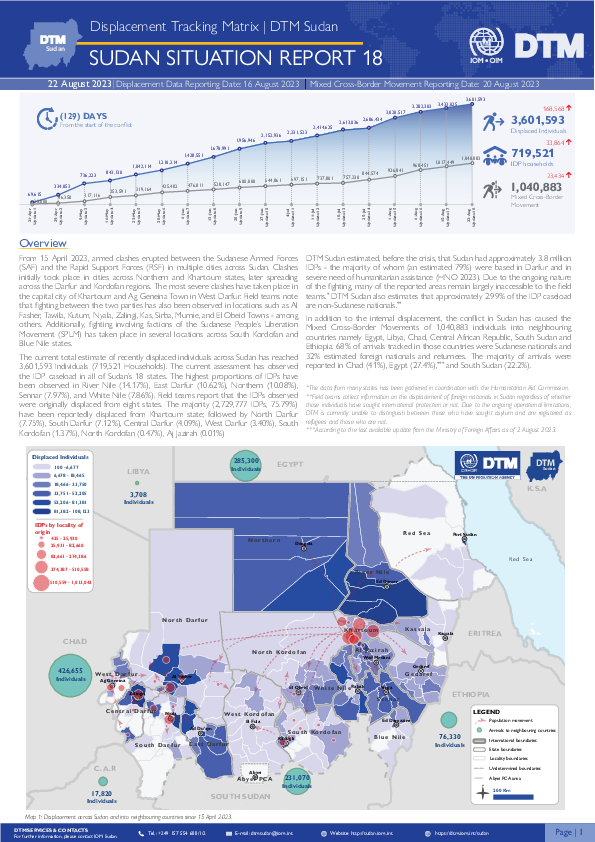
From 15 April 2023, armed clashes erupted between the Sudanese Armed Forces (SAF) and the Rapid Support Forces (RSF) in multiple cities across Sudan. Clashes initially took place in cities across Northern and Khartoum states, later spreading across the Darfur and Kordofan regions. Since Situation Report 17, the field team has reported outbreaks of violence across Kadugli locality in South Kordofan, Nyala Janoub locality in South Darfur, and Al Fasher locality in North Darfur.
Highlights
- The current total estimate of recently displaced individuals across Sudan has reached 3,601,593 Individuals (719,521 Households).
- The current assessment has observed the IDP caseload in all of Sudan’s 18 states.
- The highest proportions of IDPs have been observed in River Nile (14.17%), East Darfur (10.62%), Northern (10.08%), Sennar (7.97%), and White Nile (7.86%).
- Field teams report that the IDPs observed were originally displaced from eight states. The majority (2,729,777 IDPs, 75.79%) have been reportedly displaced from Khartoum state; followed by North Darfur (7.75%), South Darfur (7.12%), Central Darfur (4.09%), West Darfur (3.40%), South Kordofan (1.37%), North Kordofan (0.47%), Aj Jazirah (0.01%).
- DTM also reports the Mixed Cross Border Movements of 1,040,883 individuals into neighbouring countries.
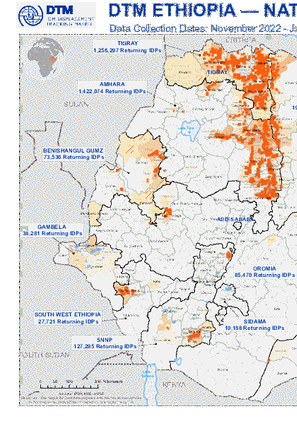
Between April and June 2023, IOM DTM deployed Site Assessment (SA) Round 33 and Village Assessment Survey (VAS) Round 16, carrying out a multisectoral location assessment in Tigray region, and a figure update in selected high mobility locations across the rest of Ethiopia. The November 2022 - January 2023 data (Round 32 for SA and Round 15 for VAS) was compiled with the April - June 2023 data (Round 33 for SA and Round 16 for VAS) to consolidate national IDP and returning IDP figures updated to June 2023. The locations assessed during both rounds of data collection are not duplicated in the consolidated figures. The National Returns Map visualizes locations of return, density of return caseload, primary reasons for initial displacement, estimated return figures, and access constraints.

Aug 03 2023
- Registration
Ce tableau de bord présente les éléments clés qui ressortent des résultats consolidés des opérations d’enregistrement dans la province du Tanganyika menées par l’OIM par le biais de sa matrice de suivi des déplacements (DTM) en coopération avec la Division des Affaires Humanitaires (DIVAH), du 25 juillet au 03 août 2023 dans 3 sites (Kaseya, Kabiyanga, et Tchofa) dans le territoire de Kongolo. La grande partie de la population enregistrée est comprise dans la catégorie d’âge de 18 à 59 ans, ce qui représente 57 pour cent du total soit (6 576 personnes). Environs 50 pour cent (5 755) de ménages enregistrés sont arrivées dans les sites au quatrième trimestre de l’année 2022 en particulier. La majorité de ménages (75%, soit 8 711 ménages) proviennent du territoire de Kabambare, 22 pour cent (2 606) de Kabalo, 1 pour cent (97) de Kongolo et 2 pour cent (218) d’autres localités.
Jul 20 2023
- Registration
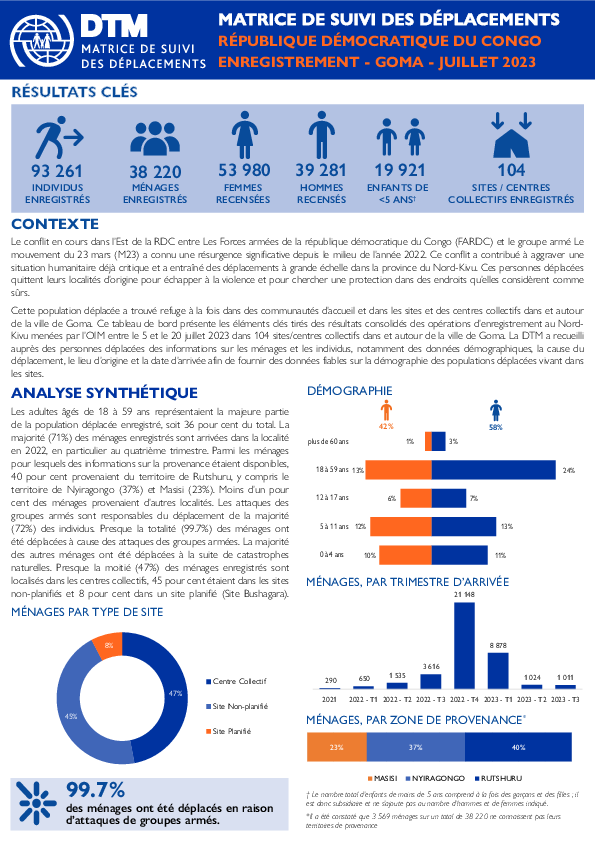
Ce tableau de bord présente les éléments clés tirés des résultats consolidés des opérations d’enregistrement au Nord-Kivu menées par l’OIM entre le 5 et le 20 juillet 2023 dans 104 sites/centres collectifs dans et autour de la ville de Goma. La DTM a recueilli auprès des personnes déplacées des informations sur les ménages et les individus, notamment des données démographiques, la cause du déplacement, le lieu d’origine et la date d’arrivée afin de fournir des données fiables sur la démographie des populations déplacées vivant dans les sites. La majorité (71%) des ménages enregistrés sont arrivées dans la localité en 2022, en particulier au quatrième trimestre. Parmi les ménages pour lesquels des informations sur la provenance étaient disponibles, 40 pour cent provenaient du territoire de Rutshuru, y compris le territoire de Nyiragongo (37%) et Masisi (23%). Moins d’un pour cent des ménages provenaient d’autres localités. Les attaques des groupes armés sont responsables du déplacement de la majorité (72%) des individus. Presque la totalité (99.7%) des ménages ont été déplacées à cause des attaques des groupes armées.
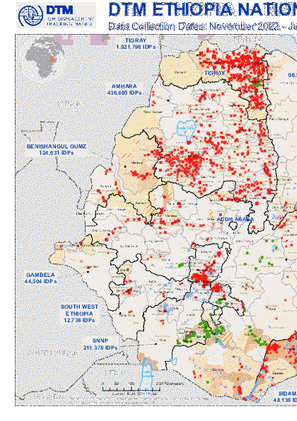
Between April and June 2023, IOM DTM deployed Site Assessment (SA) Round 33 and Village Assessment Survey (VAS) Round 16, carrying out a multisectoral location assessment in Tigray region, and a figure update in selected high mobility locations across the rest of Ethiopia. The November 2022 - January 2023 data (Round 32 for SA and Round 15 for VAS) was compiled with the April - June 2023 data (Round 33 for SA and Round 16 for VAS) to consolidate national IDP and returning IDP figures updated to June 2023. The locations assessed during both rounds of data collection are not duplicated in the consolidated figures. The National Displacement Map visualizes locations of displacement, density of displacement caseload, primary reasons for displacement, estimated displacement figures, and access constraints.

DTM API
Making global IDPs data accessible and reliable
The Displacement Tracking Matrix application programming interface (API) accelerates secure sharing of IDPs’ data, simplifying access to data across users and partners to support action, insight and foresight.