

Jun 30 2023
- Survey
- Flow Monitoring
This report is based on a survey of displacement patterns, needs and intentions conducted by IOM’s Displacement Tracking Matrix (DTM) in the 11 countries included in the Regional Response Plan for Ukraine in 2023: 6 countries neighbouring Ukraine – Belarus, Hungary, Poland, Republic of Moldova, Romania and Slovakia – and other 5 countries particularly impacted by the arrivals of refugees from Ukraine since the start of the war in February 2022 – Bulgaria, Czechia, Estonia, Latvia and Lithuania. The analysis presented in this report is based on data collected between April and June 2023.
Key Findings
• Top oblasts of origin: Odeska (28%), Vinnytska (20%), City of Kyiv (9%), Mykolaivska (7%), Zaporizka (5%), Kyivska (5%), Dnipropetrovska (3%), Kharkivska (3%).
• Intentions to move: settled or planning to settle in the Republic of Moldova (49%), transiting to another country (45%) - mainly to Romania, Germany and Canada. Move back to place of origin in Ukraine (4%).
• Employment status: employed (21%), daily workers (11%), unemployed and looking for a job (11%), student (1%), maternity leave (10%).
• Top needs*: financial support (25%), food products (12%), personal hygiene items (11%), accommodation (8%), medicines (6%).
• Top areas of assistance received*: food supplies (24%), personal hygiene items (21%), financial support (19%), accommodation (7%), vouchers (6%). • Main inclusion challenges*: financial issues (34%), housing (long-term) (16%).
• Transport: walking (28%), mini bus (26%), car (23%), and bus (12%).
* More than one answer possible

Jun 30 2023
- Survey
- Return Intention
Since 24 February 2022, refugees from Ukraine and Third Country Nationals (TCNs) have been fleeing to neighbouring countries as a result of the war. As of May 2023, more than eight million refugees from Ukraine were recorded across Europe. At the same time, almost 13 million of border crossings of border crossings of Ukrainian and Third-Country refugees and migrants were reported from Ukraine into the neighbouring countries since February 2022.
IOM has deployed its Displacement Tracking Matrix (DTM) tools since mid-April 2022 to collect individual surveys in neighbouring countries with persons crossing into Ukraine, with the aim to improve the understanding of main profiles, displacement patterns, intentions and needs of those moving into Ukraine. This report is based on surveys collected in the Republic of Moldova between 01 April 2023 and 30 June 2023 in two border crossing points, Otaci and Palanca.
Key Findings
• Top 3 countries of stay abroad: Romania (21%), Türkiye (11%), Germany (9%). • Top oblasts of origin: Odeska oblast (43%), Kyiv city and Kyivska (18%), Mykolaivska oblast (13%).
• Intended destinations: going to same oblast of origin (91%), to a different oblast (8%) - mainly to Vinnytska, Odeska & Kyiv city.
• Transport to Ukraine: car (57%), bus (31%), foot (10%).
• Intentions upon crossing back: long-term stay (58%), short-term visit (38%).
• Top needs upon crossing back:* financial support (20%), medicines and health services (6%), food products (9%), employment (8%). Other specified needs (12%) while 28% had no immediate needs.
• Top areas of assistance received:* food products and meals (27%), financial support (26%), NFI/hygiene items (22%), vouchers (2%), accommodation (8%).
* More than one answer possible
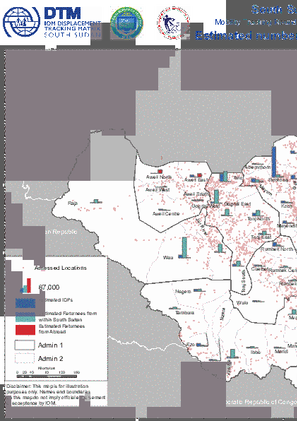
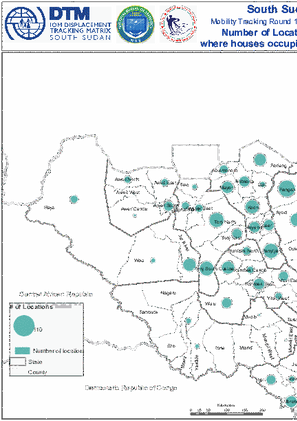
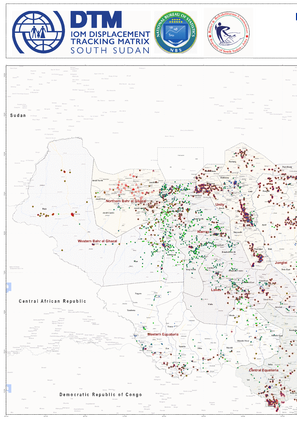
- Mobility Tracking
- Baseline Assessment
Mar 31 2023
Population Groups
Survey Methodology
Unit of Analysis Or Observation
Type of Survey or Assessment
Keywords
Geographical Scope
Administrative boundaries with available data
The current dataset covers the following administrative boundaries
- Mobility Tracking
- Baseline Assessment
Mar 31 2023
Population Groups
Survey Methodology
Unit of Analysis Or Observation
Type of Survey or Assessment
Keywords
Geographical Scope
Administrative boundaries with available data
The current dataset covers the following administrative boundaries
- Mobility Tracking
- Baseline Assessment
Mar 31 2023
Population Groups
Survey Methodology
Unit of Analysis Or Observation
Type of Survey or Assessment
Keywords
Geographical Scope
Administrative boundaries with available data
The current dataset covers the following administrative boundaries
- Mobility Tracking
- Baseline Assessment
Mar 31 2023
Population Groups
Survey Methodology
Unit of Analysis Or Observation
Type of Survey or Assessment
Keywords
Geographical Scope
Administrative boundaries with available data
The current dataset covers the following administrative boundaries

DTM API
Making global IDPs data accessible and reliable
The Displacement Tracking Matrix application programming interface (API) accelerates secure sharing of IDPs’ data, simplifying access to data across users and partners to support action, insight and foresight.