Mar 14 2023
- Mobility Tracking
- Event Tracking
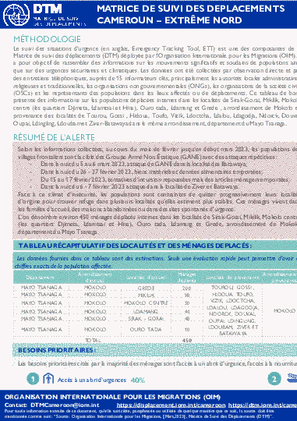
Ce tableau de bord présente des informations sur les populations déplacées internes dans les localités de Sirak-Gorai, Mikilik, Mokolo centre (les quartiers Djimeta, Ldamtsai et Hina), Ouro tada, Ldamang et Grede , arrondissement de Mokolo en provenance des localités de Tourou, Gossi , Hidoua, Toufo, Vizik, Ldoctcha, Ldalou, Ldagodja, Ndorck, Douval, Oupai, Ldingling, Ldoubamet Ziver-Batawaya dansle même arrondissement, département duMayoTsanaga.
- Other
This report explores the factors that influence migrants’ access to the rental housing market with the objective to support programming efforts to help migrants successfully navigate the rental housing market on equitable grounds. This study is based on evidence from four key urban centres in Libya (Tripoli, Misrata, Benghazi and Sebha).
The study found that sociodemographic factors, such as language skills, nationality, socioeconomic status, cultural affinity and gender were among the most important factors that influence migrants’ ability to navigate the rental housing market.
- Displacement Solutions
- Mobility Tracking
Mar 11 2023
-
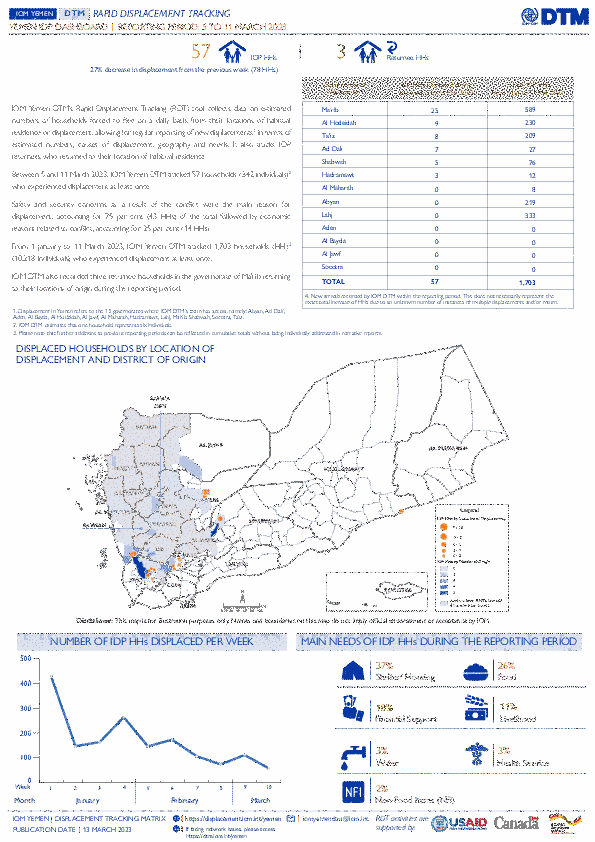
Between 5 and 11 March 2023, IOM Yemen DTM tracked 57 households (342 individuals) displaced at least once. The majority of people moved into/within the following governorates and districts:
- Ma’rib (25 HHs) – Ma’rib City (22 HHs), Ma’rib (3 HHs) districts. Most displacements in the governorate originated from Sanaa and Dhamar.
- Al Hodeidah (9 HHs) – Hays (9 HHs) district. Most displacements in the governorate originated from Al Hodeidah and Ta’iz.
- Ta’iz (8 HHs) – Jabal Habashi (4 HHs), Al Mudhaffar (2 HHs), Al Maafer (1 HHs) districts. Most displacements in the governorate were internal.
-
The majority of people moved from the following governorates and districts:
- Ta’iz (17 HHs) – Maqbanah (5 HHs), Jabal Habashi (4 HHs), Mawiyah (3 HHs) districts.
- Al Hodeidah (10 HHs) – Jabal Ras (3 HHs), Al Khukhah (3 HHs), Al Jarrahi (2 HHs) districts.
- Al Bayda (5 HHs) – Nati (5 HHs) district.
Population Groups
Survey Methodology
Unit of Analysis Or Observation
Type of Survey or Assessment
Keywords
Geographical Scope
Administrative boundaries with available data
The current dataset covers the following administrative boundaries
Mar 11 2023
- Mobility Tracking
IOM Yemen DTM’s Rapid Displacement Tracking (RDT) tool collects data on estimated numbers of households forced to flee on a daily basis from their locations of origin or displacement, allowing for regular reporting of new displacements in terms of estimated numbers, geography, and needs. It also tracks returnees who returned to their location of origin.
From 1 January to 11 March 2023, IOM Yemen DTM tracked 1,703 households (HH) (10,218 Individuals) who experienced displacement at least once.
Between 5 and 11 March 2023, IOM Yemen DTM tracked 57 households (342 individuals) displaced at least once. The majority of people moved into/within the following governorates and districts:
- Ma’rib (25 HHs) – Ma’rib City (22 HHs), Ma’rib (3 HHs) districts. Most displacements in the governorate originated from Sanaa and Dhamar.
- Al Hodeidah (9 HHs) – Hays (9 HHs) district. Most displacements in the governorate originated from Al Hodeidah and Ta’iz.
- Ta’iz (8 HHs) – Jabal Habashi (4 HHs), Al Mudhaffar (2 HHs), Al Maafer (1 HHs) districts. Most displacements in the governorate were internal.
The majority of people moved from the following governorates and districts:
- Ta’iz (17 HHs) – Maqbanah (5 HHs), Jabal Habashi (4 HHs), Mawiyah (3 HHs) districts.
- Al Hodeidah (10 HHs) – Jabal Ras (3 HHs), Al Khukhah (3 HHs), Al Jarrahi (2 HHs) districts.
- Al Bayda (5 HHs) – Nati (5 HHs) district.
Population Groups
Survey Methodology
Unit of Analysis Or Observation
Type of Survey or Assessment
Keywords
Geographical Scope
Administrative boundaries with available data
The current dataset covers the following administrative boundaries

Nov 30 2022
- Survey
- Flow Monitoring Survey
- Mobility Tracking
- Baseline Assessment
In November 2022, the Mobility Tracking Matrix (MTM) conducted the first round of its Baseline Mobility Assessment in Kyrgyzstan to track mobility, provide information on population estimates, geographic distribution of migrant workers and return migrants, reasons for migration, countries of return and periods of migration. MTM enables IOM and its partners to maximize resources, set priorities, and deliver better-targeted, evidence-based, mobility-sensitive and sustainable humanitarian assistance and development programming. For more information about MTM Kyrgyzstan please visit https://dtm.iom.int/kyrgyzstan
Data on population sizes for the three target population categories is collected by time of mobility, categorizing them yearly for 2020, 2021, and 2022.

IOM works with national and local authorities in order to gain a better understanding of population movements throughout Southern Africa. Through the setup of Flow Monitoring Points (FMPs), IOM seeks to quantify migration flows, trends and routes and to gain a better understanding of the profiles of observed individuals at entry, transit or exit points (such as border crossing posts, bus stations, rest areas, police checkpoints and reception centres). At each FMP, DTM conducts two main activities: Flow Monitoring Registry (FMR) and Flow Monitoring Surveys (FMS). This report is an overview of FMR and FMS data collected from January through December 2021 at the eight migration corridors that were active in 2021.
Inter-regional migration from and within Southern Africa is categorized along the following corridors. The Flow Monitoring Points (FMPs) were set-up in several key transit locations along the corridors to track the movements of passengers:
- Zimbabwe – Botswana (Plumtree)
- Zimbabwe (Mutare) – Mozambique (Manica)
- Zimbabwe (Chirundu) – Zambia
- South Africa – Zimbabwe (Beitbridge)
- Malawi (Mchinji) – Zambia (Mwami)
- Malawi (Karonga ) – United Republic of Tanzania
- Malawi (Mwanza) – Mozambique (Zobue)
- Malawi (Mulanje) – Mozambique
Over the reporting period a total of 430,007 movements were observed across 68 FMPs in the region and a total of 12,881 surveys were conducted at 54 FMPs.

Dec 31 2022
- Mobility Tracking
The year 2022, Uganda experienced multi-hazards events that include Natural disasters like drought, floods, landslides/mudslides and heavy storms/hailstorms. And in the month of September, the ministry of health declared the outbreak the Ebola Virus Disease in Uganda. This was also coupled with anthropogenic hazards like transport related accidents, land conflicts and fires.
A total of 171,148 individuals were affected, representing 33,476 households of which 22,456 individuals from 5,935 households were internally displaced by the disasters in 2022. Adults (19-64) were the most affected population group (47%), followed by children under 18 (43%) and the elderly above 64 (10%) in 2022. The most affected districts by disasters include Kisoro, Kasese, Mbale, Katakwi, Kampala, Wakiso and Adjumani.
Natural hazards, mostly floods, heavy storms/hailstorms and landslide combined with mudslides, ravaged the nation in disaster prone districts like Kisoro, Bulambuli, kween, Kasese, Mbale, Amuru among others.
- Mobility Tracking
- Baseline Assessment
Dec 31 2022
Population Groups
Survey Methodology
Unit of Analysis Or Observation
Type of Survey or Assessment
Keywords
Geographical Scope
Administrative boundaries with available data
The current dataset covers the following administrative boundaries
Dec 31 2022
- Mobility Tracking
- Baseline Assessment
IOM Libya’s Displacement Tracking Matrix (DTM) programme identified a total of 694,398 migrants from over 42 nationalities in the 100 Libyan municipalities during Round 45 of data collection (November - December 2022). Consistent with previous reports, the number of migrants in Libya has continued to increase slightly compared to the previous round of data collection (683,813 migrants, Round 44, September – October 2022) in line with a trend that started at the beginning of 2021. The number of migrants in Libya identified during Round 45 is the second largest since DTM started collecting data in 2016, after Round 17 (January 2018) when there were an estimated 704,142 migrants.

DTM API
Making global IDPs data accessible and reliable
The Displacement Tracking Matrix application programming interface (API) accelerates secure sharing of IDPs’ data, simplifying access to data across users and partners to support action, insight and foresight.