-
Countries
-
Data and Analysis
-
Special Focus
-
Crisis Responses

Contact
DTM Sudan, DTMSudan@iom.int
Language
English
Location
Sudan
Snapshot Date
Oct 05 2023
Activity
- Mobility Tracking
- Baseline Assessment
Overview
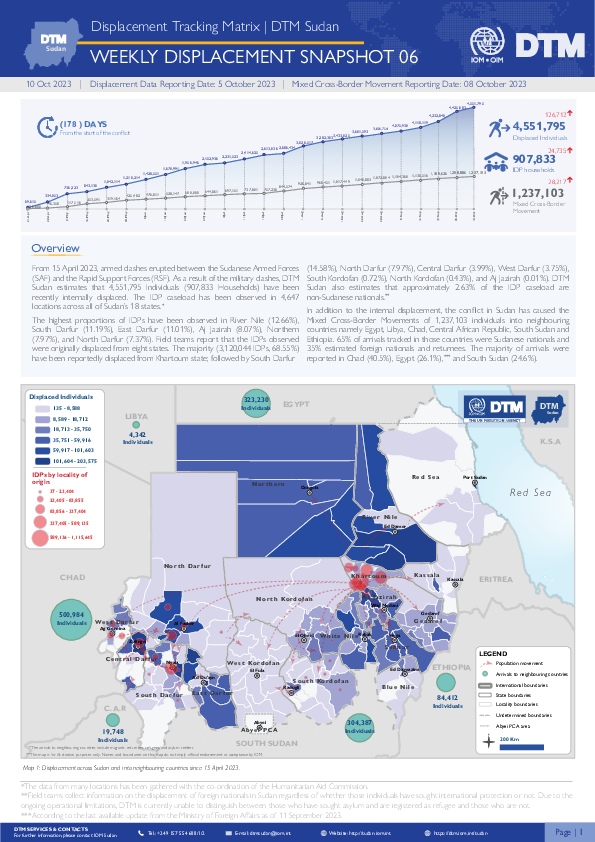
From 15 April 2023, armed clashes erupted between the Sudanese Armed Forces (SAF) and the Rapid Support Forces (RSF). Clashes initially took place in cities across Northern and Khartoum states, later spreading across the Darfur and Kordofan regions.
Key Findings
- DTM Sudan estimates that 4,551,795 Individuals (907,833 Households) have been recently internally displaced.
- The IDP caseload has been observed in 4,647 locations across all of Sudan’s 18 states.
- The highest proportions of IDPs have been observed in River Nile (12.66%), South Darfur (11.19%), East Darfur (11.01%), Aj Jazirah (8.07%), Northern (7.97%), and North Darfur (7.37%).
- Field teams report that the IDPs observed were originally displaced from eight states. The majority (3,120,044 IDPs, 68.55%) have been reportedly displaced from Khartoum state; followed by South Darfur (14.58%), North Darfur (7.97%), Central Darfur (3.99%), West Darfur (3.75%), South Kordofan (0.72%), North Kordofan (0.43%), and Aj Jazirah (0.01%).
- IOM DTM also reports that an estimated 1,237,103 mixed cross-border movements have been made into neighbouring countries.
Contact
DTM Burundi, DTMBurundi@iom.int
Location
Burundi
Activity
- Mobility Tracking
- Baseline Assessment
Period Covered
Jul 02 2023 -Jul 17 2023
73,931 IDPs and 17,151 displaced households were identified in July 2023 in Burundi.
Population Groups
Survey Methodology
Unit of Analysis Or Observation
Type of Survey or Assessment
Keywords
Geographical Scope
Administrative boundaries with available data
The current dataset covers the following administrative boundaries
Contact
DTM Yemen, iomyemendtm@iom.int
Location
Yemen
Activity
- Mobility Tracking
Period Covered
Oct 01 2023 -Oct 07 2023
From 1 January to 7 October 2023, IOM Yemen DTM tracked 4,652 households (HH) (27,912 Individuals) who experienced displacement at least once.
Between 1 and 7 October 2023, IOM Yemen DTM tracked 35 households (210 individuals) displaced at least once. The majority of people moved into/within the following governorates and districts:
- Ta’iz (13 HHs) – Al Makha (12 HHs), Salah (1 HH) districts. All displacements in the governorate were internal.
- Ma’rib (11 HHs) – Ma’rib (6 HHs), Ma’rib City (5 HHs) districts. Most displacements in the governorate originated from Hajjah and Ta’iz.
- Lahj (5 HHs) – Tuban (3 HHs), Al Hawtah (2 HHs) districts. Most displacements in the governorate originated from Al Hodeidah and Ta’iz.
- Ta’iz (19 HHs) – Maqbanah (8 HHs), At Ta’iziyah (4 HHs), Al Waziyah (3 HHs) districts.
- Al Hodeidah (5 HHs) – Al Hali (2 HHs), Al Jarrahi (1 HH), Jabal Ras (1 HH) districts.
- Ma’rib (3 HHs) – Al Jubah (3 HHs) district.
Population Groups
Survey Methodology
Unit of Analysis Or Observation
Type of Survey or Assessment
Keywords
Geographical Scope
Administrative boundaries with available data
The current dataset covers the following administrative boundaries

Contact
DTM Yemen, iomyemendtm@iom.int
Language
English
Location
Yemen
Period Covered
Oct 01 2023
Oct 07 2023
Activity
- Mobility Tracking
IOM Yemen DTM’s Rapid Displacement Tracking (RDT) tool collects data on estimated numbers of households forced to flee on a daily basis from their locations of origin or displacement, allowing for regular reporting of new displacements in terms of estimated numbers, geography, and needs. It also tracks returnees who returned to their location of origin.
From 1 January to 7 October 2023, IOM Yemen DTM tracked 4,652 households (HH) (27,912 Individuals) who experienced displacement at least once.
Between 1 and 7 October 2023, IOM Yemen DTM tracked 35 households (210 individuals) displaced at least once. The majority of people moved into/within the following governorates and districts:
- Ta’iz (13 HHs) – Al Makha (12 HHs), Salah (1 HH) districts. All displacements in the governorate were internal.
- Ma’rib (11 HHs) – Ma’rib (6 HHs), Ma’rib City (5 HHs) districts. Most displacements in the governorate originated from Hajjah and Ta’iz.
- Lahj (5 HHs) – Tuban (3 HHs), Al Hawtah (2 HHs) districts. Most displacements in the governorate originated from Al Hodeidah and Ta’iz.
The majority of people moved from the following governorates and districts:
- Ta’iz (19 HHs) – Maqbanah (8 HHs), At Ta’iziyah (4 HHs), Al Waziyah (3 HHs) districts.
- Al Hodeidah (5 HHs) – Al Hali (2 HHs), Al Jarrahi (1 HH), Jabal Ras (1 HH) districts.
- Ma’rib (3 HHs) – Al Jubah (3 HHs) district.
Contact
dtmuganda@iom.int vwabwire@iom.in
Location
Uganda
Activity
- Mobility Tracking
- Baseline Assessment
Period Covered
Aug 01 2023 -Aug 31 2023
In August 2023, 2904 individuals and 864 households were affected. 1041 individuals and 24 households were internally displaced.
Population Groups
Survey Methodology
Unit of Analysis Or Observation
Type of Survey or Assessment
Keywords
Geographical Scope
Administrative boundaries with available data
The current dataset covers the following administrative boundaries
IOM works with national and local authorities in order to gain a better understanding of population movements throughout Southern Africa. Through
the setup of Flow Monitoring Points (FMPs), IOM seeks to quantify migration flows, trends and routes and to gain a better understanding of the profiles of observed individuals at entry, transit or exit points (such as border crossing posts, bus stations, rest areas, police checkpoints and reception centres). This report is an overview of the data collected in these FMPs from 1 to 31 August 2023. Inter-regional migration from and within the Southern Africa is categorized along the following corridors. The Flow Monitoring Points (FMPs) were set-up in several key transit locations along the corridors to track the movements of passengers:
• Zimbabwe (Mutare) – Mozambique (Manica)
• Zimbabwe (Chirundu) – Zambia
• Zimbabwe – Botswana (Plumtree)
• Zimbabwe – South Africa (Beitbridge)
• Malawi (Mchinji) – Zambia (Mwami)
• Malawi (Karonga) – United Republic of Tanzania
• Malawi (Mwanza) – Mozambique (Zobue)
• Malawi (Mangochi) – Mozambique
• Mozambique (Ressano Garcia) – South Africa
Over the reporting period a total of 71,106 movements were observed across 43 FMPs in the region. The Zimbabwe – South Africa (Beitbridge) corridor hosted the largest number of movements with 42,394 (60%), followed by the Malawi (Mwanza) – Mozambique (Zobue) corridor with 10,038 (14%) and the Zimbabwe (Chirundu) – Zambia corridor with 5,764 (8%) movements reported.

Contact
iommexicodtm@iom.int
Language
Spanish
Location
Mexico
Period Covered
Aug 01 2023
Aug 31 2023
Activity
- Flow Monitoring
- Event Tracking
Este ejercicio considera Ciudad Juárez durante el mes de agosto 2023. La OIM realizó 279 encuestas aleatorias e individuales, las cuales consideran 638 personas en el grupo familiar.

Contact
iommexicodtm@iom.int
Language
Spanish
Location
Mexico
Period Covered
Jul 01 2023
Jul 31 2023
Activity
- Flow Monitoring
- Event Tracking
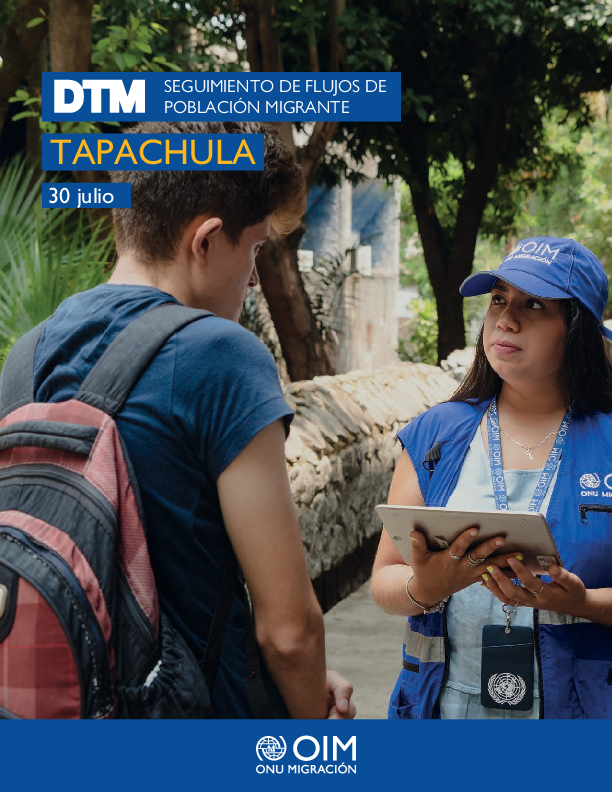
En este ejercicio se considera Tapachula durante el mes de julio 2023. La OIM realizó 307 encuestas aleatorias e individuales, las cuales consideran 588 personas en el grupo familiar.

Contact
iommexicodtm@iom.int
Language
Spanish
Location
Mexico
Period Covered
Jul 01 2023
Jul 31 2023
Activity
- Flow Monitoring
- Event Tracking
Este ejercicio considera Tenosique durante el mes de julio 2023. La OIM realizó 165 encuestas aleatorias e individuales, las cuales consideran 338 personas en el grupo familiar.
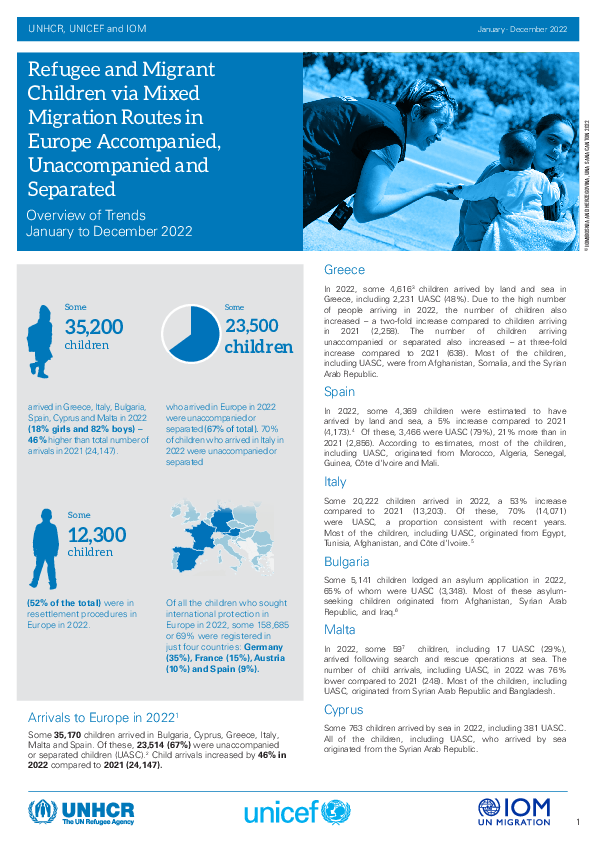
- Some 35,200 children arrived in Greece, Italy, Bulgaria, Spain, Cyprus and Malta in 2022 (18% girls and 82% boys) – 46% higher than total number of arrivals in 2021 (24,147).
- Some 23,500 children who arrived in Europe in 2022 were unaccompanied or separated (67% of total). 70% of children who arrived in Italy in 2022 were unaccompanied or separated
- Some 12,300 children (52% of the total) were in resettlement procedures in Europe in 2022.
- Of all the children who sought international protection in Europe in 2022, some 158,685 or 69% were registered in just four countries: Germany (35%), France (15%), Austria (10%) and Spain (9%).

