
- Mobility Tracking
- Event Tracking
On 6 January 2024, a Non-State Armed Group (NSAG) carried out an attack in Gujba, Asheikri and Gabir/Maduri wards in Gujba, Geidam and Damaturu LGAs of Yobe State, leading to a substantial wave of population displacement.
As a result of the attack, a total of 9,965 individuals from 1,536 households were displaced from their homes forcing them to seek refuge in nearby communities or makeshift shelters.
Feb 17 2024
- Mobility Tracking
- Event Tracking
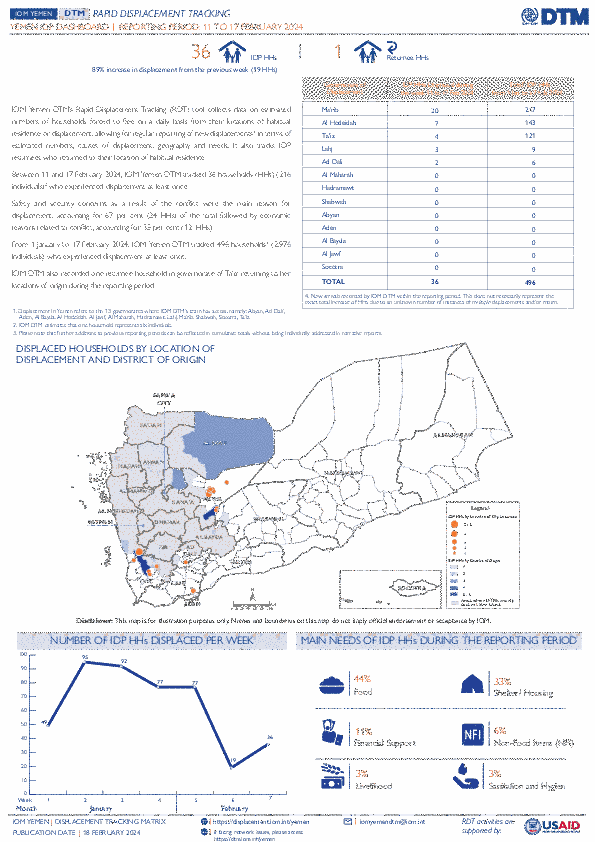
IOM Yemen DTM’s Rapid Displacement Tracking (RDT) tool collects data on estimated numbers of households forced to flee on a daily basis from their locations of origin or displacement, allowing for regular reporting of new displacements in terms of estimated numbers, geography, and needs. It also tracks returnees who returned to their location of origin.
From 1 January to 17 February 2024, IOM Yemen DTM tracked 496 households (HH) (2,976 Individuals) who experienced displacement at least once.
Between 11 and 17 February 2024, IOM Yemen DTM tracked 36 households (216 individuals) displaced at least once. The majority of people moved into/within the following governorates and districts:
- Ma’rib (20 HHs) – Ma’rib City (9 HHs), Ma’rib (8 HHs), Harib (3 HHs) districts. Most displacements in the governorate originated from Ma’rib and Sanaa.
- Al Hodeidah (7 HHs) – Hays (6 HHs), Al Khukhah (1 HHs) districts. Most displacements in the governorate were internal.
- Ta’iz (4 HHs) – Maqbanah (3 HHs), Al Qahirah (1 HHs) districts. All displacements in the governorate were internal.
The majority of people moved from the following governorates and districts:
- Al Hodeidah (9 HHs) – Hays (6 HHs), At Tuhayta (2 HHs), Al Qanawis (1 HHs) districts.
- Ta’iz (8 HHs) – Maqbanah (5 HHs), Sharab As Salam (2 HHs), Sabir Al Mawadim (1 HHs) districts.
- Ma’rib (7 HHs) – Harib (6 HHs), Majzar (1 HHs) districts.
IOM identified 56 households displaced in the previous reporting period, which covered 04 - 10 February 2024, in the governorates of Ma’rib (27 HHs), Ta’iz (20 HHs), Al Hodeidah (9 HHs). These figures have been added to the cumulative displacement total recorded since the beginning of the year.
- Mobility Tracking
- Event Tracking
Feb 17 2024
From 1 January to 17 February 2024, IOM Yemen DTM tracked 496 households (HH) (2,976 Individuals) who experienced displacement at least once.
Between 11 and 17 February 2024, IOM Yemen DTM tracked 36 households (216 individuals) displaced at least once. The majority of people moved into/within the following governorates and districts:
- Ma’rib (20 HHs) – Ma’rib City (9 HHs), Ma’rib (8 HHs), Harib (3 HHs) districts. Most displacements in the governorate originated from Ma’rib and Sanaa.
- Al Hodeidah (7 HHs) – Hays (6 HHs), Al Khukhah (1 HHs) districts. Most displacements in the governorate were internal.
- Ta’iz (4 HHs) – Maqbanah (3 HHs), Al Qahirah (1 HHs) districts. All displacements in the governorate were internal.
The majority of people moved from the following governorates and districts:
- Al Hodeidah (9 HHs) – Hays (6 HHs), At Tuhayta (2 HHs), Al Qanawis (1 HHs) districts.
- Ta’iz (8 HHs) – Maqbanah (5 HHs), Sharab As Salam (2 HHs), Sabir Al Mawadim (1 HHs) districts.
- Ma’rib (7 HHs) – Harib (6 HHs), Majzar (1 HHs) districts.
Population Groups
Survey Methodology
Unit of Analysis Or Observation
Type of Survey or Assessment
Keywords
Geographical Scope
Administrative boundaries with available data
The current dataset covers the following administrative boundaries
Dec 31 2023
- Flow Monitoring
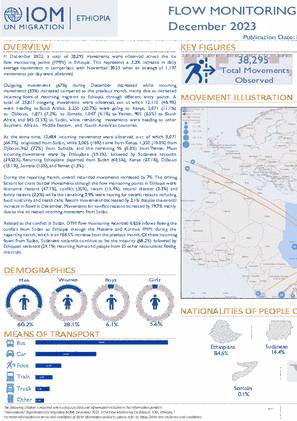
In December 2023, a total of 38,295 movements were observed across the six flow monitoring points (FMPs) in Ethiopia. This represents a 3.2% increase in daily average movements in comparison with November 2023 when an average of 1,197 movements per day were observed.
Outgoing movements (67%) during December decreased while incoming movements (33%) increased compared to the previous month, mainly due to increased incoming flows of returning migrants to Ethiopia through different entry points. A total of 25,811 outgoing movements were observed, out of which 12,110 (46.9%) were heading to Saudi Arabia, 5,350 (20.7%) were going to Kenya, 2,871 (11.1%) to Djibouti, 1,871 (7.2%) to Somalia, 1,067 (4.1%) to Yemen, 905 (3.5%) to South Africa, and 645 (2.5%) to Sudan, while remaining movements were heading to other Southern African, Middle Eastern, and North American countries.
At the same time, 12,484 incoming movements were observed, out of which 8,071 (64.7%) originated from Sudan, while 2,005 (16%) came from Kenya, 1,350 (10.8%) from Djibouti, 963 (7.7%) from Somalia, and the remaining 95 (0.8%) from Yemen. Most incoming movements were by Ethiopians (59.3%), followed by Sudanese nationals (39.22%). Returning Ethiopians departed from Sudan (40.5%), Kenya (27.1%), Djibouti (18.1%), Somalia (13%), and Yemen (1.3%).

Feb 16 2024
- Mobility Tracking
- Event Tracking
Although included within this cumulative displacement estimate- the current Movement Alert #98 reports on recent attacks recorded in Macomia, Chiure and Mecu¬ between 8 to 16 February that displaced 4,212 individuals. Within this reporting period, arrivals of displaced families have been mapped across villages of Ancuabe, Macomia, Chiure, Muidumbe, Quissanga, Metuge, Montepuez, Mecufi¬, Erati and Ibo.
Of the total individuals displaced between 8-16 February, 249 families with 900 individuals have taken refuge in displacement centres of Chiure (Maningane, Muajaja, and Namisir) 143 families with 424 individuals have taken refuge in displacement centres of Macomia (Nanga A and Nanga B), 15 families with 64 individuals have taken refuge in displacement centre of Montepuez (Ntele), 18 families with 72 individuals have taken refuge in displacement centre of Metuge (Ngunga), 10 families with 19 individuals have taken refuge in displacement centre of Muidumbe (Lutete) 2 families with 16 individuals have taken refuge in displacement centre of Mueda (Lyanda) and 3 families with 8 individuals have taken refuge in displacement centres of Ancuabe (Cujupane, Nanjua).

Dec 29 2023
- Mobility Tracking
This summary presents findings of the 20th round of Mobility Tracking Assessments (previously known as Baseline Assessments) conducted across Northern, Central and Southern Mozambique through key-informant and group interviews at location level between November and December 2023. Mobility Tracking assessments provides a geographical overview of demographic and mobility profiles of internally displaced persons (IDPs) and returnees across Mozambique. During this round, IOM DTM mapped a total of 709,529 IDPs and 632,408 returnees in 364 locations. Cabo Delgado hosts 76 per cent of the overall IDP figure followed by Sofala (11%). Estimated 55 per cent of the total IDPs were identified in host communities whilst 45 per cent are living in displacement sites. Conflict was the major trigger of displacements in Northern Mozambique whereas most of the displacements in Central Mozambique were triggered by disasters due to natural hazards. The total figure of IDPs decreased by 17 per cent comparing to the previous round. However, the analysis suggests that this decrease does not directly correlate with an increased rate of returnee. In Round 20, there was an 11 per cent increase in returnees. This follows significant household-level verification efforts to ensure best estimates.
- Mobility Tracking
- Site Assessment
- Baseline Assessment
Dec 29 2023
This Multi-Sectorial Location Assessment Round 13 assessment aims to enhance understanding of the extent of internal displacements and the needs of the displaced population affected by conflict and natural disaster in eight provinces of Mozambique. In total, 317,224 internally displaced persons (IDPs) or 81,383 households were mapped living in sites assessed during this MSLA Round 13.
Population Groups
IDPs
Survey Methodology
Unit of Analysis Or Observation
Admin Area 2
Admin Area 3
Admin Area 4
Site or Location
Type of Survey or Assessment
Key Informant
Keywords
Geographical Scope Partial Coverage
Administrative boundaries with available data
The current dataset covers the following administrative boundaries
- Mobility Tracking
- Baseline Assessment
Dec 29 2023
This dataset is the 20th round of Mobility Tracking Assessments conducted across Mozambique through key-informant assessments and group interviews at the location level in December 2023. Mobility Tracking assessments estimate the presence of internally displaced persons (IDPs) and returnees across Mozambique. IOM DTM mapped a total of 709,529 IDPs and 632,408 returnees in round 20.
A more detailed version of this dataset is available, to get access kindly click on the 'Request Access' button
Population Groups
IDPs
Returnee (Previously Internally Displaced)
Survey Methodology
Unit of Analysis Or Observation
Admin Area 2
Admin Area 3
Admin Area 4
Site or Location
Type of Survey or Assessment
Key Informant
Keywords
Geographical Scope Partial Coverage
Administrative boundaries with available data
The current dataset covers the following administrative boundaries
- Mobility Tracking
- Baseline Assessment
Feb 07 2024
- DTM Sudan estimates that 6,217,222 individuals (1,238,945 households) were recently internally displaced.
- The IDP caseload was observed in 6,709 locations across all of Sudan’s 18 states.
- The highest proportions of IDPs were observed across South Darfur (12%), River Nile (11%), East Darfur (11%), White Nile (8%), North Darfur (7%), Sennar (7%), Central Darfur (7%), Northern (6%), Gedaref (6%), and Aj Jazirah (6%).
- Field teams reported that the IDPs observed were originally displaced from twelve states. The majority (3,530,771 IDPs, 57%) were reportedly displaced from Khartoum state; followed by South Darfur (15%), North Darfur (8%), Aj Jazirah (7%), Central Darfur (4%), West Darfur (4%), East Darfur (1%), South Kordofan (1%), West Kordofan (1%), North Kordofan (1%), Sennar (<1%), and White Nile (<1%).
- IOM-DTM also reported that an estimated 1,803,213 mixed cross-border movements were made into neighbouring countries.
- This product provides brief insights into those displaced in Sudan post-15 April 2023. For more granular information on the IDP caseload and the displacement context, please see IOM-DTM's Monthly Displacement Overview (05).
A more detailed version of this dataset is available, to get access kindly click on the 'Request Access' button
Population Groups
IDPs
Survey Methodology
Unit of Analysis Or Observation
Site or Location
Type of Survey or Assessment
Key Informant
Keywords
Geographical Scope Partial Coverage
Administrative boundaries with available data
The current dataset covers the following administrative boundaries
Jan 30 2024
- Flow Monitoring
- Mobility Tracking
- Event Tracking
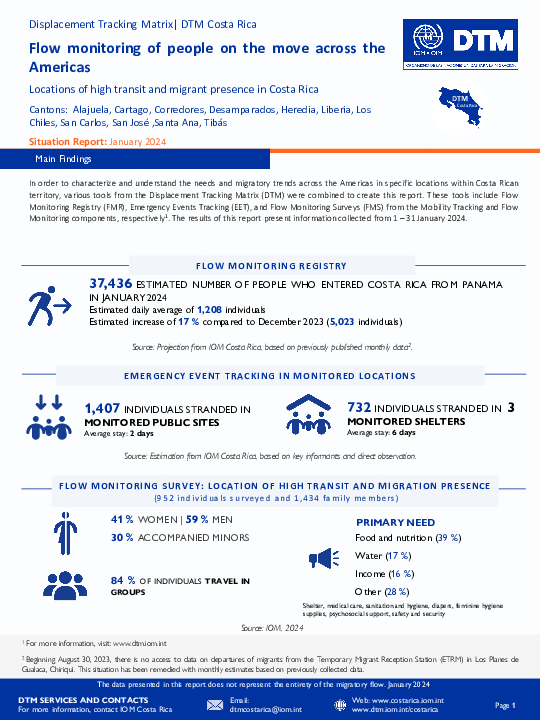
Cantons: Alajuela, Cartago, Corredores, Desamparados, Heredia, Liberia, Los Chiles, San Carlos, San José, Santa Ana y Tibás
Costa Rica, like the other countries in the Central American region, has been characterized as a migratory corridor for people who transit by land from the south to the north of America and whose destination is the countries in the north of the continent. This flow on the move through the Americas is mainly made up of people from the Bolivarian Republic of Venezuela, Cuba, Haiti, Ecuador, as well as people from other countries in South America, Africa and Asia.
According to estimations from IOM Costa Rica, during December 37,436 people entered the country, an approximate average of 1,208 people per day and estimating a increase of 30% compared to December 2023. In addition, 1,407 people stranded in the monitored shelters were identified and 732 people stranded in the public places visited.

DTM API
Making global IDPs data accessible and reliable
The Displacement Tracking Matrix application programming interface (API) accelerates secure sharing of IDPs’ data, simplifying access to data across users and partners to support action, insight and foresight.