-
Countries
-
Data and Analysis
-
Special Focus
-
Crisis Responses
East and the Horn of Africa
DTM East and the Horn of Africa
DTM Operations in the region
- Active DTM operation
- Past DTM operation
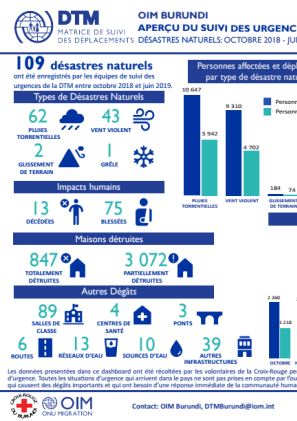
Burundi — Dashboard des déplacements pour des désastres naturels (Octobre 2018 - Juin 2019)
D'octobre 2018 à juin 2019, les équipes de suivi des urgences de DTM ont rendu compte des conséquences de 109 catastrophes naturelles. Au cours de cette période, 20 177 personnes ont été touchées et 10 551 personnes déplacées.
Burundi — Displacement Dashboard for Natural Disasters (October 2018 - June 2019)
From October 2018 until June 2019, DTM emergency tracking teams have reported on the effects of 109 natural disasters. During this period there have been 20 177 affected persons, and 10 551 displaced person.
South Sudan — Flow Monitoring Dashboard (May 2019)
DTM’s Flow Monitoring Registry (FMR) surveys people on the move at key transit points within South Sudan (SSD) and at its borders.
South Sudan — Ebola Preparedness Flow Monitoring Dashboard (May 2019)
As part of IOM’s Ebola Virus Disease (EVD) preparedness activities, DTM operates Flow Monitoring Points (FMPs) on the borders with Uganda (UGA), the Democratic Republic of Congo (DRC) and the Central African Republic (CAR). In total, 21 EVD-dedicated FMPs were active in May.
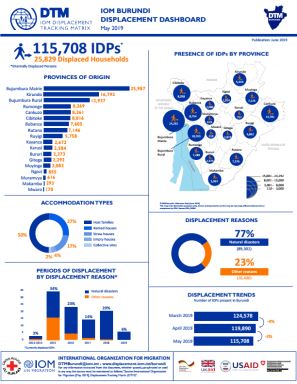
Burundi — Displacement Dashboard (May 2019)
During May 2019, DTM has identified 115,708 IDPs. The main causes for the displacements have been: 77 per cent natural disasters and 23 per cent other reasons.
Jul 02 2019
Burundi — Displacement Dashboard (May 2019)
Burundi — Dashboard des déplacements (Mai 2019)
Au cours du mois de Mai, la DTM a identifié 115,708 personnes déplacées internes. Les principaux motifs de déplacement ont été : désastres naturels (77%) et autres raisons (23%).
Jul 02 2019
Burundi — Dashboard des déplacements (Mai 2019)
Somalia — Border Point Flow Monitoring (May 2019)
In May 2019, a total of 24 ,018 movements were observed at Flow Monitoring Points. This represents a significant decrease (29%) in comparison with April 2019 when 32 ,933 movements were observed.
Burundi — Flow Monitoring Report (April 2019)
From 01 to 30 April 2019, 46,630 movements were observed at 8 flow monitoring points in the provinces of Muyinga, Cankuzo, Ruyigi and Rutana.
Jun 28 2019
Burundi — Flow Monitoring Report (April 2019)
Burundi — Rapport De Suivi Des Mouvements Transfrontaliers (Avril 2019)
Du 1er au 30 avril 2019, 46,630 mouvements ont été observés sur 8 points de transit dans les provinces de Muyinga, Cankuzo, Ruyigi et Rutana.
South Sudan — Mobility Tracking: IDPs and Returnees by sub-area
IOM’s Displacement Tracking is pleased to share with you several maps and a dataset detailing data on the numbers and locations of IDPs and returnees in all counties for 444 sub-areas (payam) disaggregated by period of displacement / return (data collection in March 2019).
Uganda — Flow Monitoring Dashboard: Uganda/South Sudan Border (1-31 May 2019)
Over the reporting period, a total of 33,667 individual movements were observed at six (6) Flow Monitoring Points (FMPs) at the Ugandan (UGA) border with South Sudan (SSD).
Uganda — Flow Monitoring Dashboard: Uganda/DRC Border (1-31 May 2019)
Over the reporting period, a total of 124,156 movements were observed at eight (8) Flow Monitoring Points (FMPs) at the border with the Democratic Republic of Congo (DRC).
East and Horn of Africa — Monthly Regional Update (April 2019)
The DTM Monthly Regional Update contains consolidated summary updates and highlights from DTM field operations in April 2019.
Est et Corne de l’Afrique - Fiche d'information 2019
Le bureau régional de la DTM a porté assistance à la mise en place d’un réseau de 65 points de suivi des flux migratoires, sur les quatre routes principales dans la région (voir carte ci-dessus) à Djibouti (11), en Ethiopie (5), en Somalie (7), au Soudan du Sud (19), en Ouganda (15) et au Burundi
Jun 11 2019
Est et Corne de l’Afrique - Fiche d'informati…
South Sudan — Map: Mobility Tracking Round 5 — Locations By Type As Of March 2019
This map, based on Mobility Tracking Round 5 Baseline data, shows locations hosting IDPs and returnees by type in South Sudan as of March 2019.
South Sudan — Map: Mobility Tracking Round 5 — IDPs by county as of March 2019
This map, based on Mobility Tracking Round 5 Baseline data, shows the number of IDPs by county in South Sudan as of March 2019.
South Sudan — Mobility Tracking Round 5 Baseline Locations Summary
This summary represents findings for the fifth round of Mobility Tracking, conducted in South Sudan through key-informant based assessments at sub-area and location levels.
South Sudan — Map: Mobility Tracking Round 5 — Returnees By County As Of March 2019
This map, based on Mobility Tracking Round 5 Baseline data, shows the number of returnees by county in South Sudan as of March 2019.
East And Horn of Africa — Monthly Regional Snapshot (April 2019)
The DTM Monthly Regional Snapshot contains summary updates of DTM field operations. It is published on a monthly basis and covers the East Africa and Horn of Africa Region.
South Sudan — Ebola Preparedness Flow Monitoring Report (January-April 2019)
As part of IOM’s Ebola Virus Disease (EVD) preparedness activities, DTM operates Flow Monitoring Points (FMPs) on the borders with Uganda (UGA), the Democratic Republic of Congo (DRC) and the Central African Republic (CAR).
South Sudan — Wau PoC AA Headcount (May 2019)
Throughout 2018 until February 2019, DTM observed a steady decline of Wau PoC AA site’s population. However, between March and May, the population increased by 30 per cent (by 4,248 individuals).
Jun 07 2019
South Sudan — Wau PoC AA Headcount (May 2019)
South Sudan — Event Tracking: Tambura (May 2019)
The International Organization for Migration’s Displacement Tracking Matrix (DTM) has identify 446 IDPs (174 Households) in Tambura Centre (Tambura County), Western Equatoria confirming recent reports of new displacement in the area.
Jun 07 2019
South Sudan — Event Tracking: Tambura (May 2019)
Ethiopia — Displacement Report 16, Afar (March - April 2019)
50,092 displaced individuals comprising 9,227 households in 58 displacement sites were identified in Afar region.
Ethiopia — National Displacement Dashboard 16 (March - April 2019)
The majority of the recorded population were displaced before 2018 with 890 sites reportedly opening in 2016 or 2017 (DTM Rounds 1-8). Conflict was reported as the primary driver of displacement with 1,623,716 conflict-affected IDPs tracked through the Site Assessment.
Pagination
Pagination
- First page
- Previous page
- …
- 10
- 11
- 12
- 13
- 14
- 15
- 16
- 17
- 18
Pagination
- First page
- Previous page
- …
- 16
- 17
- 18
- 19
- 20
- 21
- 22
- 23
- 24


