Ethiopia - Countrywide Monitoring
Pays dans cette réponse
- Active DTM operation
- Past DTM operation
Check out the interactive dashboard
Ethiopia - Site Assessment Dashboard
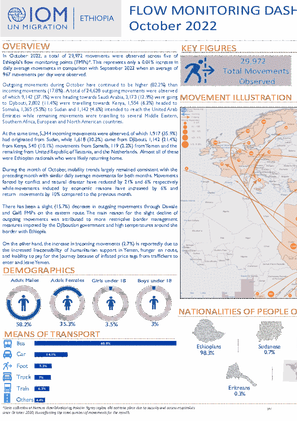
In October 2022, a total of 29,972 movements were observed across five of Ethiopia's flow monitoring points (FMPs). This represents only a 0.01% increase in daily average movements in comparison with September 2022 when an average of 967 movements per day were observed.
In September 2022, a total of 28,983 movements were observed across five of Ethiopia's flow monitoring points (FMPs). This represents an 11% increase in daily average movements in comparison with August 2022 when an average of 871 movements per day were observed.

In order to capture the displacement and return dynamics in Ethiopia, DTM Ethiopia's National Displacement Report combines findings from its Site Assessment (SA) in Section 1 and findings from the Village Assessment Survey (VAS) in Section 2.

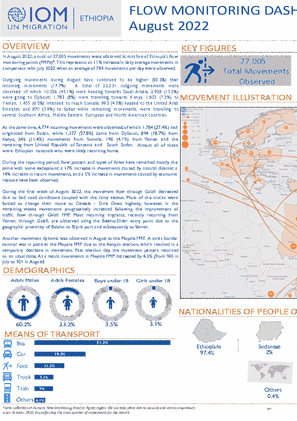
In August 2022, a total of 27,005 movements were observed across five of Ethiopia's flow monitoring points (FMPs). This represents an 11% increase in daily average movements in comparison with July 2022 when an average of 784 movements per day were observed.
In July 2022, a total of 24,297 movements were observed across five of Ethiopia's flow monitoring points (FMPs). This represents a 2% decrease in daily average movements in comparison with June 2022 when an average of 802 movements per day were observed.

Between 1 November 2020 and 31 January 2021, DTM Ethiopia surveyed a total of 2,324 migrants across 5 Flow Monitoring Points (FMPs). These FMPs are located in Metema, Galafi, Moyale, Dawale and Tog Wochale.

In order to capture the displacement and return dynamics in Ethiopia, DTM Ethiopia's National Displacement Report combines findings from its Site Assessment (SA) in Section 1 and findings from the Village Assessment Survey (VAS) in Section 2.

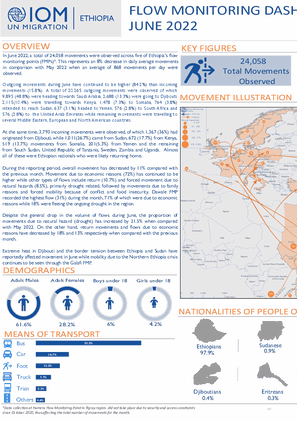
In June 2022, a total of 24,058 movements were observed across five of Ethiopia's flow monitoring points (FMPs)*. This represents an 8% decrease in daily average movements in comparison with May 2022 when an average of 868 movements per day were observed.
In May 2022, a total of 26,920 movements were observed across five of Ethiopia's flow monitoring points (FMPs). This represents a 2% decrease in daily average movements in comparison with April 2022 when an average of 889 movements per day were observed.

Between 1 August and 31 October 2020, DTM Ethiopia surveyed a total of 1,911 migrants across 6 Flow Monitoring Points (FMPs). These FMPs are located in Humera, Metema, Galafi, Moyale, Dawale and Tog Wochale.

Between 1 May and 31 July 2021, DTM Ethiopia surveyed a total of 2,680 migrants across 5 Flow Monitoring Points (FMPs). These FMPs are located in Metema, Galafi, Moyale, Dawale and Tog Wochale.

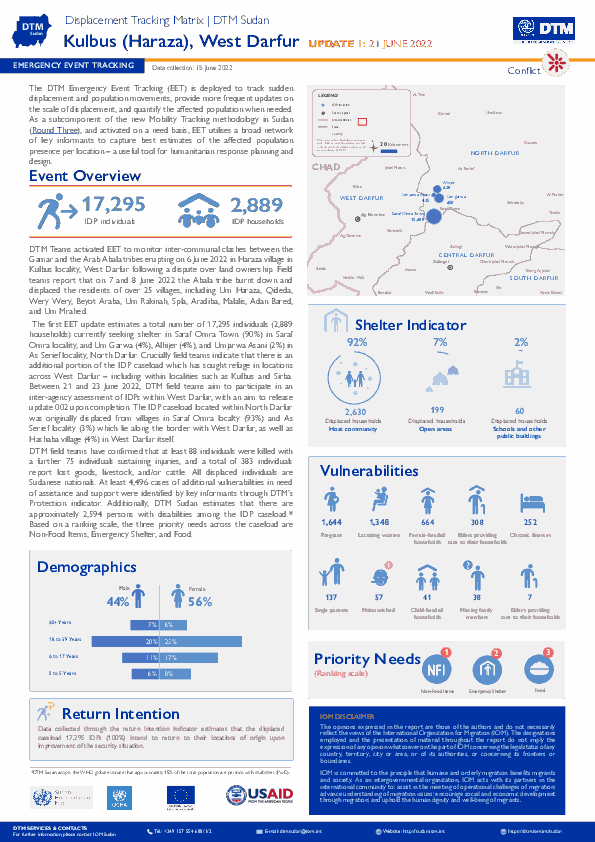
The DTM Emergency Event Tracking (EET) is deployed to track sudden displacement and population movements, provide more frequent updates on the scale of displacement, and quantify the affected population when needed.

DTM Global Survey 2023
The Displacement Tracking Matrix (DTM) Global Survey 2023 is an annual stocktaking exercise which aims to present IOM DTM's operations and activities transparently. The Global Survey focuses on operations active from January 1 to December 31, 2023, with data collection occurring from February to April 2024.