Lake Chad Basin Crisis
Pays dans cette réponse
- Active DTM operation
- Past DTM operation
Check out the interactive dashboard
Nigeria - Needs Monitoring
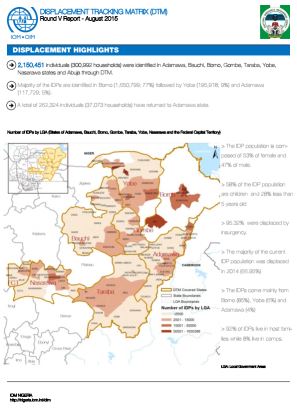
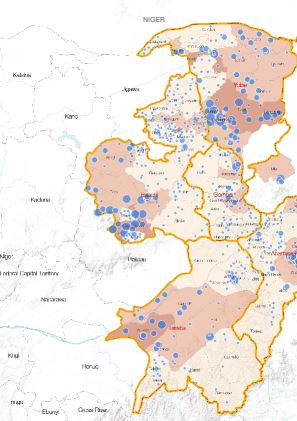
As of August 2015, this Site Assessment Dashboard identified 2,150,451 IDPs (300,992 households), of which 170,368 IDPs were staying in 59 camps and camp-like settings. Most IDPs were identified in Borno, Adamawa, Abuja and Yobe.
As of August 2015, 2,150,451 IDPs or300,992 households were identified in the fifth round of assessments. Of these, 170,368 IDPs were identified in 59 camps. The dashboard includes a map of displacement severity by Local Government Area (LGA) and ward.
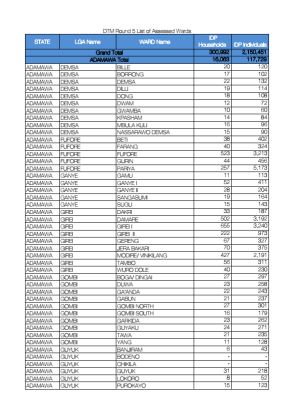
2,150,451 IDPs (300,992 households) were identified in Adamawa, Bauchi, Borno, Gombe, Taraba, Yobe, Nasarawa states and Abuja. Borno state (1,650,799 IDPs) has the highest number of IDPs, followed by Yobe (195,918 IDPs) and Adamawa (117,729 IDPs).
2,150,451 displaced individuals (300,992 households) were identified in Round 20 DTM in Nigeria.This document provides the list of wards assessed and the numbers of individuals and households identified in each, organised by State and Local Government Area (LGA).
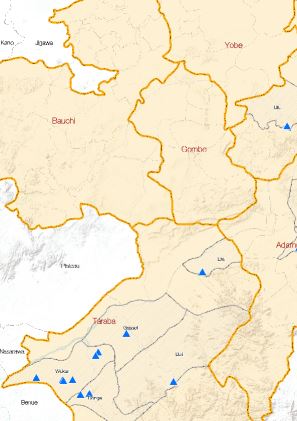
This Site Assessment Dashboard identified 1,385,298 IDPs (188,547 households), of which 111,141 IDPs are living in 42 sites. Most (99,648) IDPs were identified in Borno, followed by Adamawa where 6,813 IDPs were identified.
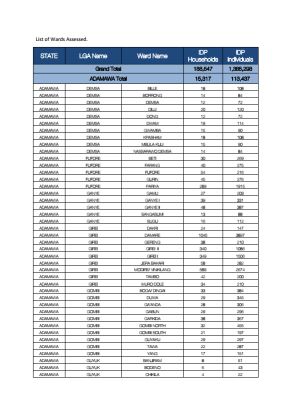
As of June 2015, 1,385,298 IDPs in 188,547 households were identified in the fourth round of assessments.
1,385,298 displaced individuals (188,547 households) were identified in Round 4 of DTM in Nigeria.This document provides the list of wards assessed and the numbers of individuals and households identified in each, organised by State and Local Government Area (LGA).
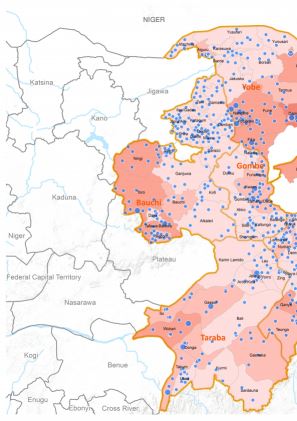
As of 29 April 2015, 1,491,706 IDPs in 194,145 households were identified in the third round of assessments. Of these, 147,285 IDPs were identified in 42 camps. The dashboard includes a map of displacement severity by Local Government Area (LGA) and ward.
This document lists all the wards assessed in DTM Round 3 by state, Local Government Area and ward, showing the total number of displaced individuals and households identified.

A total of 1,491,706 IDPs (194,145 households) were identified in Adamawa, Bauchi, Borno, Gombe, Taraba and Yobe states. Borno state (939,290 IDPs) has the highest number of IDPs, followed by Adamawa (222,882 IDPs) and Yobe (139,591 IDPs).

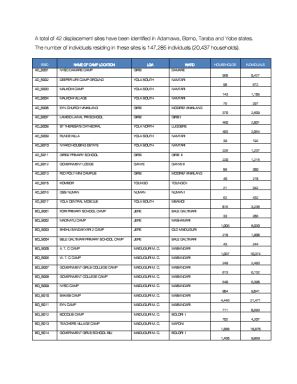
This document lists all the sites assessed in DTM Round 3 including the site ID, site name, Local Government Area, ward name, number of households and number of individuals.
This document lists all the wards assessed in DTM Round 2 by state, Local Government Area and ward, showing the total number of displaced individuals and households identified.


DTM API
Making global IDPs data accessible and reliable
The Displacement Tracking Matrix application programming interface (API) accelerates secure sharing of IDPs’ data, simplifying access to data across users and partners to support action, insight and foresight.