-
Countries
-
Data and Analysis
-
Special Focus
-
Crisis Responses
Nigeria
Nigeria
Suivi des PDI
Mouvements de déplacement
3,340,000
IDMC 2023
cycle de collecte de données
À propos Nigeria
The escalation of violence between all parties in north-eastern Nigeria since 2014 has resulted in mass displacement and deprivation in the states of Adamawa, Bauchi, Borno, Gombe, Taraba and Yobe. To better understand the scope of displacement and assess the needs of affected populations, IOM has been implementing its Displacement Tracking Matrix (DTM) programme starting July 2014, in collaboration with the National Emergency Management Agency (NEMA) and State Emergency Management Agencies (SEMAs). The activities of the DTM project, which consist of conducting baseline assessments and registration for IDPs living in camps and host communities, are currently being carried out in Adamawa, Bauchi, Borno, Gombe, Taraba and Yobe.
The information collected will contribute to the provision of a comprehensive profile of the IDP population in Nigeria which will be shared with all relevant stakeholders and will contribute towards enabling the government of Nigeria and humanitarian partners identify the needs of Nigeria's displaced population and develop interventions for providing IDPs necessary assistance.
Contacter
DTM Nigeria
DTMNigeria@iom.int
Bailleurs de fonds
- ECHO
- BHA
- Canada
Nigeria — Site Assessment Dashboard 4 (June 2015)
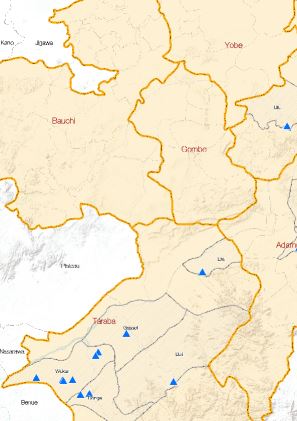
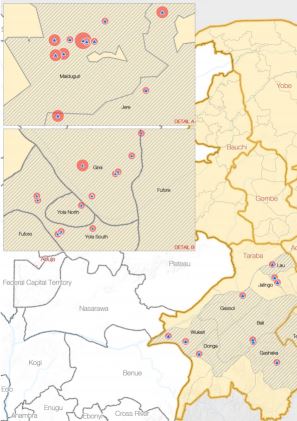
This Site Assessment Dashboard identified 1,385,298 IDPs (188,547 households), of which 111,141 IDPs are living in 42 sites. Most (99,648) IDPs were identified in Borno, followed by Adamawa where 6,813 IDPs were identified.
Nigeria — Displacement Dashboard 4 (May — June 2015)
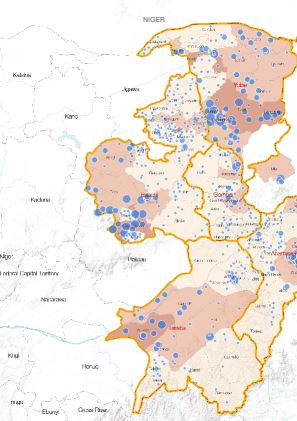
As of June 2015, 1,385,298 IDPs in 188,547 households were identified in the fourth round of assessments.
Nigeria — List of Wards Assessed 4 (1 May — 30 June 2015)
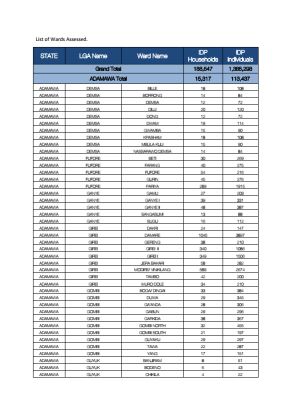
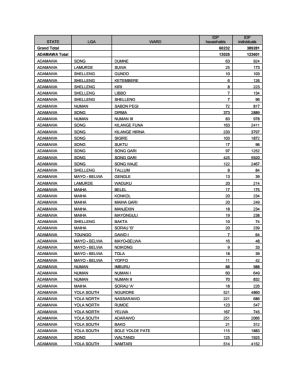
1,385,298 displaced individuals (188,547 households) were identified in Round 4 of DTM in Nigeria.This document provides the list of wards assessed and the numbers of individuals and households identified in each, organised by State and Local Government Area (LGA).
Nigeria — Displacement Dashboard 3 (1 March — 29 April 2015)
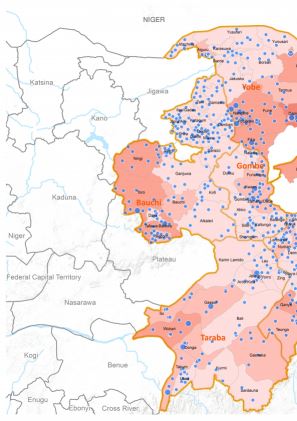
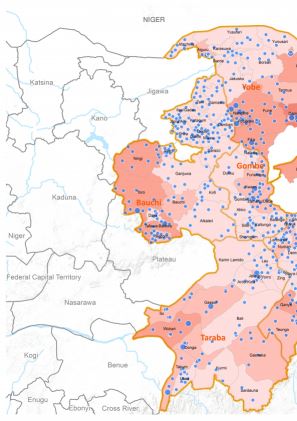
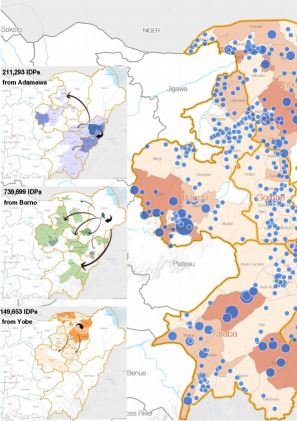
As of 29 April 2015, 1,491,706 IDPs in 194,145 households were identified in the third round of assessments. Of these, 147,285 IDPs were identified in 42 camps. The dashboard includes a map of displacement severity by Local Government Area (LGA) and ward.
Nigeria — Site Assessment Dashboard 3 (29 April 2015)
Round 3 of the DTM site assessments in northeastern Nigeria identified 1,491,706 IDPs (or 194,145 households). These include 147,285 IDP in 42 camps.
Nigeria — List of Wards Assessed 3 (1 March — 30 April 2015)
This document lists all the wards assessed in DTM Round 3 by state, Local Government Area and ward, showing the total number of displaced individuals and households identified.
Nigeria — List of Displacement Sites Assessed 3 (1 March — 30 April 2015)
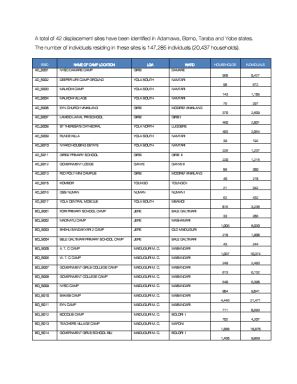
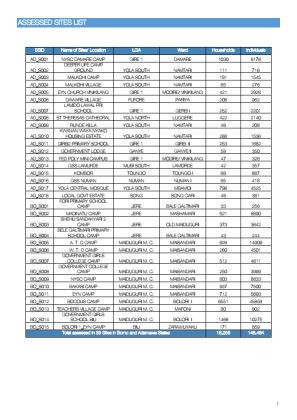
This document lists all the sites assessed in DTM Round 3 including the site ID, site name, Local Government Area, ward name, number of households and number of individuals.
Nigeria — Displacement Report 3 (1 March — 30 April 2015)
A total of 1,491,706 IDPs (194,145 households) were identified in Adamawa, Bauchi, Borno, Gombe, Taraba and Yobe states. Borno state (939,290 IDPs) has the highest number of IDPs, followed by Adamawa (222,882 IDPs) and Yobe (139,591 IDPs).
Nigeria — Borno Site Profiles 2 (1 January — 28 February 2015)
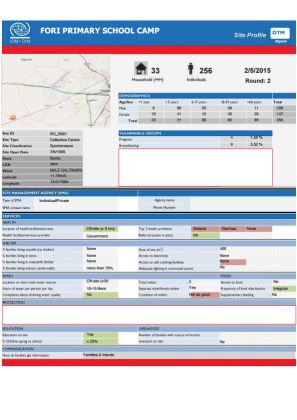
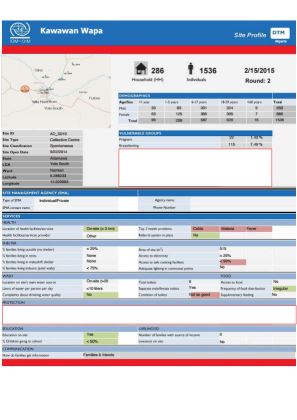
This document contains the site profiles for all displacement sites identified in Borno state, Nigeria.
Nigeria — Adamawa Site Profiles 2 (1 January — 28 February 2015)
This document contains the site profiles for all displacement sites identified in Adamawa state, Nigeria.
Nigeria — List of Wards Assessed 2 (1 January — 28 February 2015)
This document lists all the wards assessed in DTM Round 2 by state, Local Government Area and ward, showing the total number of displaced individuals and households identified.
Nigeria — List of Displacement Sites Assessed 2 (1 January — 28 February 2015)
This document lists all the sites assessed in DTM Round 2 including the site ID, site name, Local Government Area, ward name, number of households and number of individuals.
Nigeria — Site Assessment Dashboard 2 (1 January — 28 February 2015)
1,188,018 IDPs in 149,357 households were identified in 43 displacement sites in Adamawa, Borno and Taraba states. 27,612 IDPs are displaced in 18 sites in Adamawa state. 120,872 IDPs are displaced in 15 sites in Borno state. 5,524 IDPs are displaced in 10 sites in Taraba state.
Nigeria — Displacement Dashboard 2 (1 January — 28 February 2015)
1,188,018 IDPs in 149,357 households were identified in six states in north-eastern Nigeria in January to February 2015. 56% of the IDP population in the sites are children, 8.7% are below 1 year old and 54% are female. 7.5% of the IDP population is above 60 years old.
Nigeria — Displacement Report 2 (1 January — 28 February 2015)
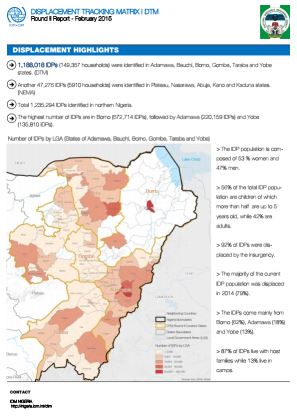
A total of 1,235,294 IDPs were identified in northern Nigeria. 1,188,018 IDPs (149,357 households) were identified in Adamawa, Bauchi, Borno, Gombe, Taraba and Yobe states. Another 47,276 IDPs (5,910 households) were identified in Plateau, Nasarawa, Abuja, Kano and Kaduna states.
Nigeria — List of Wards Assessed 1 (October — December 2014)
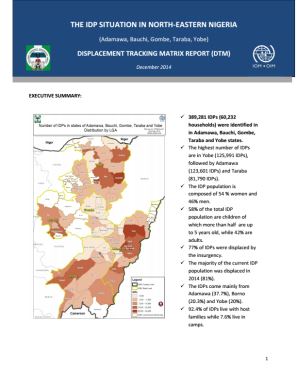
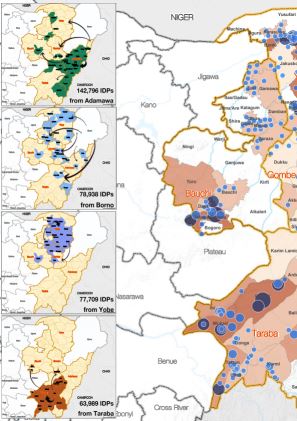
389,281 displaced individuals (60,232 households) were identified in DTM's first Round in Nigeria.
Nigeria — Emergency Tracking Tool Report 1 (December 2014)
This displacement report covers the period of October to December 2014. In Adamawa, Bauchi, Gombe, Taraba and Yobe states, 389,281 IDPs (60,232 households) were identified.
Nigeria — Displacement Dashboard 1 (December 2014)
As of 14 December 2014, 389,281 IDPs in 60,232 households were identified in the first round of assessments.
Nigeria — Displacement Dashboard 13 (1 July 2014—31 December 2016)
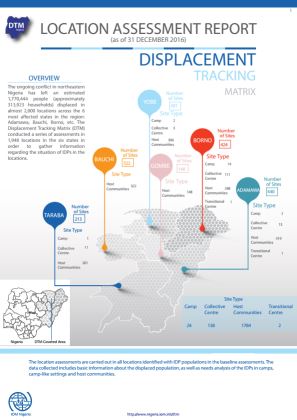
As of the 31 December, the conflict in the northeastern part of Nigeria has left an estimated 1,770,444 people displaced across 6 most affected states.
NIGERIA — MULTI-SECTORAL LOCATION ASSESSMENT: ENERGY ACCESS
This report presents a summary of the analysis of the Round 7 data collection of the Displacement Tracking Matrix (DTM) Multi-Sectoral Location Assessment (MLSA) in the North Central and North West Geopolitical Zones of Nigeria and Round 38 of the DTM MSLA in the North East Geopolitical Zone.
Nigeria — Site Assessment Dashboard 14 (19 December 2016—25 January 2017)
The dashboard is a map indicating the number of returnees per LGA. 1,099,509 returnees returned to Adamawa, Borno and Yobe States. 64,151 (5.8%) are Nigerian refugees from Chad and Cameroon. The map indicates return areas, inaccessible areas, water boundaries and state boundaries.
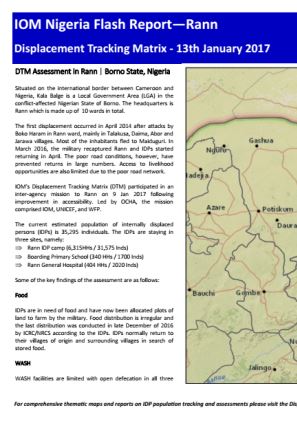
Nigeria — Rann, Kala—Balge LGA Flash Report (13 January 2017)
Situated on the international border between Cameroon and Nigeria, Kala Balge is a Local Government Area (LGA) in the conflict-affected Nigerian State of Borno. The current estimated population of IDPs is 35,295 individuals.
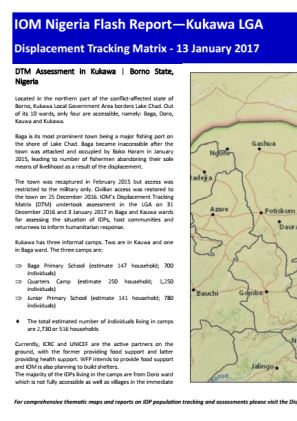
Nigeria — Kukawa LGA Flash Report (13 January 2017)
Analysis of the DTM data collected across 63 IDP camps between the 13-17 December. 4,030 individuals comprising 1,033 families were recorded across these camps, 49% of these were living in improvised structures.
Pagination
Pagination
- First page
- Previous page
- 1
- 2
- 3
- 4
- 5
- 6
- 7
- 8
Pagination
- First page
- Previous page
- 1
- 2
- 3
- 4
- 5
- 6
- 7


