-
Countries
-
Data and Analysis
-
Special Focus
-
Crisis Responses
Ethiopia
À propos Ethiopia
Ethiopia faces one of the most complex human mobility environments in the world, with a range of social, economic, political, and climatic factors driving populations within and outside its borders. .
The Data and Research Unit (DRU) at IOM Ethiopia, through its Displacement Tracking Matrix (DTM) methodology, gathers and analyzes data to disseminate critical multi layered information on the mobility, vulnerabilities, and needs of displaced and mobile populations that enables decision makers and responders to provide these populations with better context specific assistance. Since its launch in September 2016 in Ethiopia, the DTM has grown to be a fully integrated component of Ethiopia’s national and sub-national information management architecture, as it is the official source of data on internal displacement in the country. In Ethiopia, DRU implements the following three DTM components: Mobility Tracking (MT), Flow Monitoring (FM) and Surveys.
Mobility Tracking (MT) captures internal displacement and return through three annual rounds of Site Assessment (SA) (focused on IDPs, their multisectoral needs and the availability of services in their areas of displacement) and Village Assessment Survey (VAS) (focused on host community capacity to absorb returns targeting returning IDPs and their access to services with a focus on livelihoods and reintegration). MT data is largely used to inform humanitarian response and development planning and as such is coordinated with both humanitarian and development actors in country as well as with the Ethiopia Disaster Risk Management Commission.
Flow Monitoring (FM) captures inter-and intra-regional migration flows daily at key identified transit locations. This information is largely used to inform developmental programming including migrant assistance and protection programming. Through a route-based analysis, FM data has played a pivotal role in providing evidence base to respond to the Sudan crisis coordination.
Through the regular nationwide SA and VAS tools that fall under the MT component of the DTM methodology, the DRU builds and regularly updates a master-list of locations and information about how mobile population categories are geographically spread throughout the country. The baseline information contained in the master-lists allows for the construction of sampling frameworks and the selection of statistically representative samples. Using the sampling frameworks obtained through the nationwide regular assessments, DRU is able to plan and implement household level and individual Surveys to provide representative, granular information which can be triangulated with pre-existing DTM data, as well as external data sources. This data enables the humanitarian and development communities to obtain important insight into the needs, conditions, vulnerabilities, and intentions of mobile populations which can be particularly useful in informing programs, especially with regards to durable solutions, livelihoods, and other Humanitarian, Development and Peace Nexus (HDPN) related programming and policy initiatives.
DTM Ethiopia deploys over 200 staff and enumerators to track displacement, returns and mobile populations in the country.
More information on the methodology can be found under resources.
Bailleurs de fonds
- Norway
- USAID
- DG ECHO
- DG INTPA
- European Commission
- MPTF
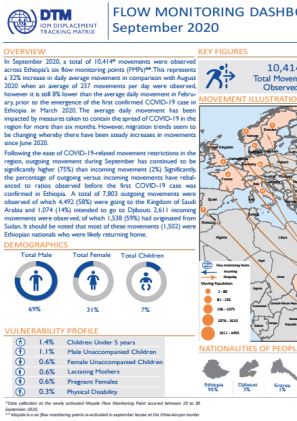
Ethiopia — Flow Monitoring Dashboard 12 (September 2020)
In September 2020, a total of 10,414* movements were observed across Ethiopia’s six flow monitoring points (FMPs).
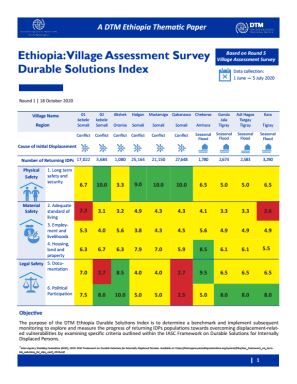
Ethiopia — Thematic Paper: Village Assessment Survey Durable Solutions Index Report 1
The DTM Ethiopia Village Assessment Survey Durable Solutions Index Report measures the progress of returning IDP populations towards overcoming displacement-related vulnerabilities by examining specific criteria outlined within the IASC Framework on Durable Solutions for Internally Dis
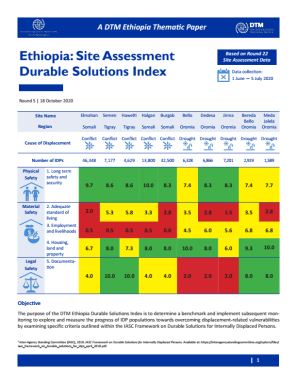
Ethiopia — Thematic Paper: Site Assessment Durable Solutions Index Report 5
The DTM Ethiopia Site Assessment Durable Solutions Index Report measures the progress of IDP populations towards overcoming displacement-related vulnerabilities by examining specific criteria outlined within the IASC Framework on Durable Solutions for Internally Displaced Persons.
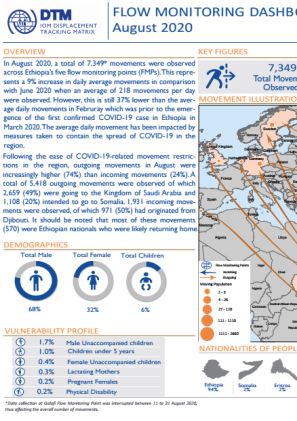
Ethiopia — Flow Monitoring Dashboard 11 (August 2020)
In August 2020, a total of 7,349 movements were observed across Ethiopia’s five flow monitoring points (FMPs).
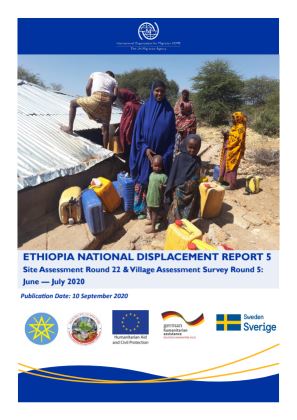
Ethiopia — National Displacement Report 5 (June — July 2020)
In order to capture the displacement and return dynamics in Ethiopia, DTM Ethiopia's National Displacement Report combines findings from its Site Assessment (SA) in Section 1 and findings from the Village Assessment Survey (VAS) in Section 2.
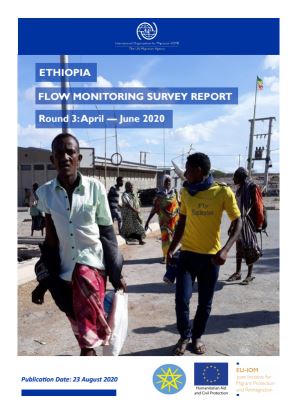
Ethiopia — Flow Monitoring Survey Report 3 (April — June 2020)
Between 1 April to 30 June 2020, DTM Ethiopia surveyed a total of 907 migrants across 5 Flow Monitoring Points (FMPs).
Ethiopia — Flow Monitoring Dashboard 10 (June 2020)
In June 2020, a total of 6,525 movements were observed across Ethiopia’s five flow monitoring points (FMPs). This represents a 122% increase in daily average movement in comparison with May 2020 when an average of 98 movements per day were observed.
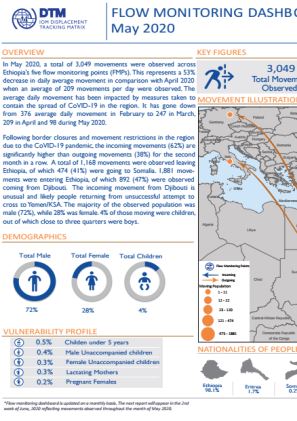
Ethiopia — Flow Monitoring Dashboard 9 (May 2020)
In May 2020, a total of 3,049 movements were observed across Ethiopia’s five flow monitoring points (FMPs). This represents a 53% decrease in daily average movement in comparison with April 2020 when an average of 209 movements per day were observed.
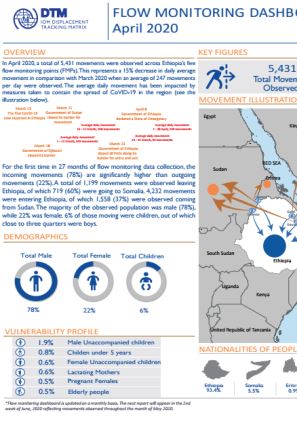
Ethiopia — Flow Monitoring Dashboard 8 (April 2020)
In April 2020, a total of 5,431 movements were observed across Ethiopia's five flow monitoring points (FMPs).
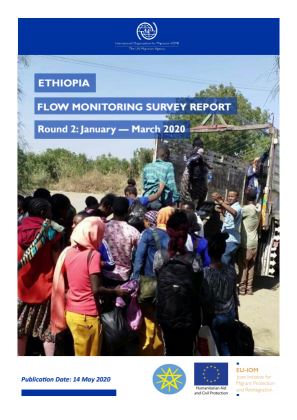
Ethiopia — Flow Monitoring Survey Report 2 (January — March 2020)
Between 1 January to 31 March 2020, DTM Ethiopia surveyed a total of 1,325 migrants across five Flow Monitoring Points (FMPs). These FMPs are located in Humera, Metema, Galafi, Dawale and Tog Wochale.
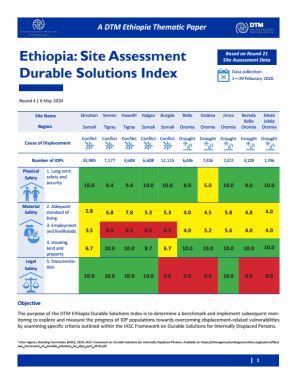
Ethiopia — Thematic Paper: Site Assessment Durable Solutions Index Report 4
The DTM Ethiopia Site Assessment Durable Solutions Index Report measures the progress of IDP populations towards overcoming displacement-related vulnerabilities by examining specific criteria outlined within the IASC Framework on Durable Solutions for Internally Displaced Persons.
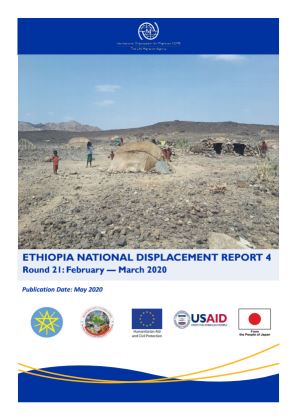
Ethiopia — National Displacement Report 4 (February — March 2020)
In order to capture the displacement and mobility dynamics in Ethiopia, DTM Ethiopia's National Displacement Report combines its findings from its Site Assessment (SA) in Section 1 and findings from the Village Assessment Survey (VAS) in Section 2.
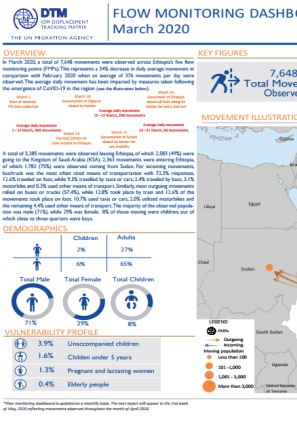
Ethiopia — Flow Monitoring Dashboard 7 (March 2020)
In March 2020, a total of 7,648 movements were observed across Ethiopia's five flow monitoring points (FMPs).
Ethiopia — Flow Monitoring Dashboard 6 (February 2020)
In February 2020, a total of 10,907 movements were observed across Ethiopia’s five flow monitoring points (FMPs). This represents a 5% increase in daily average movement in comparison with January 2020 when an average of 359 movements per day were observed.
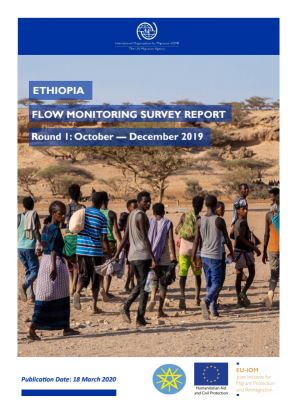
Ethiopia — Flow Monitoring Survey Report 1 (October — December 2019)
Between 1 October to 31 December 2019, DTM Ethiopia surveyed a total of 1,703 migrants across five Flow Monitoring Points (FMPs). These FMPs are located in Humera, Metema, Galafi, Dawale and Tog Wochale.
Ethiopia — Flow Monitoring Dashboard 5 (January 2020)
In January 2020, a total of 11,137 movements were observed across Ethiopia’s five flow monitoring points (FMPs). This represents a 7% increase in daily average movement in comparison with December 2019 when an average of 336 movements per day were observed.
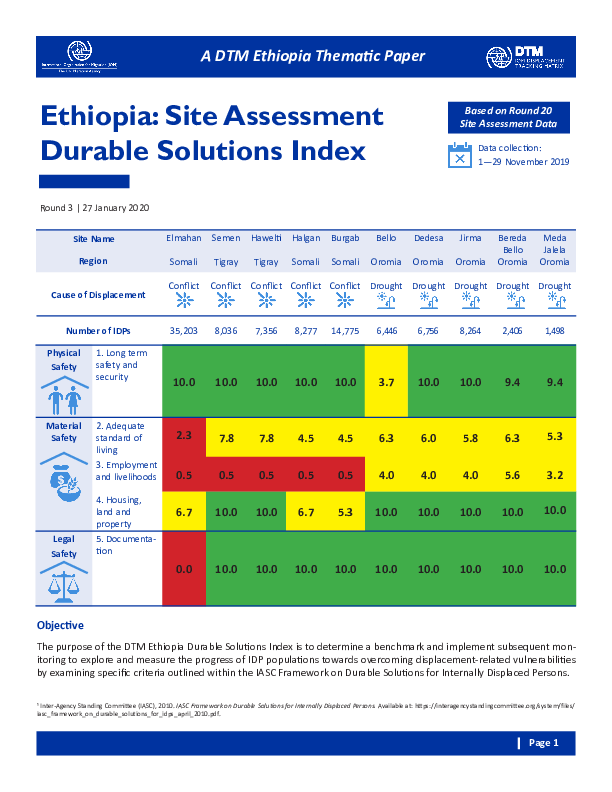
Ethiopia — Thematic Paper: Site Assessment Durable Solutions Index Report 3
The DTM Ethiopia Site Assessment Durable Solutions Index Report measures the progress of IDP populations towards overcoming displacement-related vulnerabilities by examining specific criteria outlined within the IASC Framework on Durable Solutions for Internally Displaced Persons.
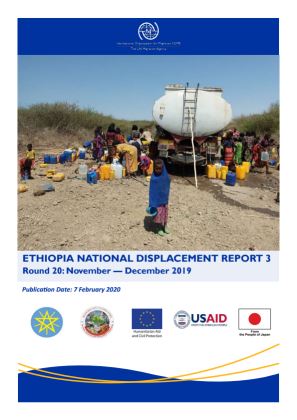
Ethiopia — National Displacement Report 3 (November — December 2019)
In order to capture the displacement and mobility dynamics in Ethiopia, DTM Ethiopia's National Displacement Report combines its findings from its Site Assessment (SA) in Section 1 and findings from the Village Assessment Survey (VAS) in Section 2.
Ethiopia — Flow Monitoring Dashboard 4 (December 2019)
In December 2019, a total of 10,410 movements were observed across Ethiopia’s five flow monitoring points (FMPs). This represents a 4 per cent decrease in comparison with November 2019 when 9,989 movements were observed.
Ethiopia — Thematic Paper: Site Assessment Durable Solutions Index Report 2
The DTM Ethiopia Site Assessment Durable Solutions Index Report measures the progress of IDP populations towards overcoming displacement-related vulnerabilities by examining specific criteria outlined within the IASC Framework on Durable Solutions for Internally Displaced Persons.
Ethiopia — Flow Monitoring Dashboard 3 (November 2019)
In November 2019, a total of 9,989 movements were observed across Ethiopia’s five flow monitoring points (FMPs). This represents a 5 per cent decrease in comparison with October 2019 when 10,554 movements were observed.
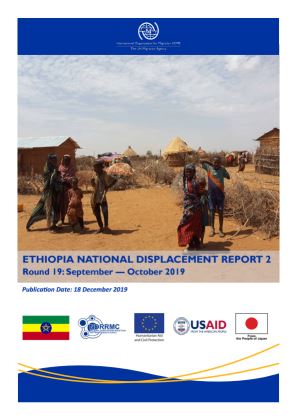
Ethiopia — National Displacement Report 2 (September — October 2019)
In order to capture the displacement and mobility dynamics in Ethiopia, DTM Ethiopia’s National Displacement Report combines its findings from its Site Assessment (SA) in Section 1 and findings from the Village Assessment Survey (VAS) in Section 2.
Ethiopia - Flow Monitoring Dashboard 2 (October 2019)
In October 2019, a total of 10,554 movements were observed across Ethiopia’s five flow monitoring points (FMPs). This represents a 3% increase in comparison with September 2019 when 10,208 movements were observed.
Ethiopia - Flow Monitoring Dashboard 1 (September 2019)
In September 2019, a total of 10,208 movements were observed across Ethiopia's Five Flow Monitoring Points. This represents a 6% decrease in comparison with August 2019 when 10,858 movements were observed.


