-
Countries
-
Data and Analysis
-
Special Focus
-
Crisis Responses
East, Horn and Southern Africa
DTM East, Horn and Southern Africa
DTM Operations in the region
- Active DTM operation
- Past DTM operation
Para obtener resultados de búsqueda más avanzados, vaya a la Página de búsqueda avanzada de informes
Mozambique — Tropical Cyclone Kenneth — Site Profiles - Round 7 (November 2019)
The International Organization for Migration (IOM), in coordination with the Government of Mozambique through National Institute for Disaster Risk Management (INGC), carried out the seventh round of site assessments in five open sites: Tratara Resettlement Site, Chuiba Transit Centre, Chapa
Djibouti — Rapport Sur Les Points De Suivi Des Flux (Septembre 2019)
Au cours du mois de Septembre, le nombre moyen d’individus observés par jour a été de 798, ce qui correspond à une augumentation de 18% par rapport aux 674 individus observés en moyenne quotidiennement au mois précédent.
Mozambique — Baseline Assessment - Cyclone Idai - Round 7
From 04 to 07 October, in close coordination with Mozambique’s National Institute for Disaster Management (INGC), IOM DTM (Displacement Tracking Matrix) teams conducted baseline assessments at locality level (localidade), which corresponds to the lowest administrative level in the country.
Ethiopia - Flow Monitoring Dashboard 2 (October 2019)
In October 2019, a total of 10,554 movements were observed across Ethiopia’s five flow monitoring points (FMPs). This represents a 3% increase in comparison with September 2019 when 10,208 movements were observed.
Uganda — Flow Monitoring Dashboard: Uganda/DRC Border (May-August 2019)
This document offers an analysis of the population movement dynamics and the profile of people moving across the Uganda border with the Democratic Republic of the Congo.
Mozambique — Cyclone Idai- Site Profiles — Round 10 — October 2019
From 09 October to 16 October, in close coordination with Mozambique’s National Institute for Disaster Management (INGC), IOM’s Displacement Tracking Matrix (DTM) teams conducted multi-sectoral location assessments (MSLA) at resettlement sites in the four affected Provinces.
Ebola Virus Disease PoE Preparedness At Screening Points – Kanungu District (1-31 October 2019)
The Ebola Virus Disease (EVD) Points of Entry (PoE) preparedness dashboards for Kanungu District was covered from 1 october to 31 October 2019. Eight (8) of the referenced Points of Entry (PoEs) had active screening activities during the reporting period.
Ebola Virus Disease PoE Preparedness at Screening Points – Rubirizi District (1-31 October 2019)
The Ebola Virus Disease (EVD) Points of Entry (PoE) preparedness dashboards for Rubirizi District was covered from 1 October to 31 October 2019. All four (4) landing sites referenced are informal PoEs and have active screening operations in place during reporting period.
Ebola Virus Disease PoE Preparedness At Screening Points – Rukungiri District (1-31 October 2019)
The Ebola Virus Disease (EVD) Points of Entry (PoE) preparedness dashboards for Rukungiri District was covered from 1 October to 31 October 2019.
Ebola Virus Disease PoE Preparedness At Screening Points – Kisoro District (1-31 October 2019)
The Ebola Virus Disease (EVD) Points of Entry (PoE) preparedness dashboards for Kisoro District was covered from 1 October to 31 October 2019. Kisoro has seven (7) Points of Entry (PoEs) with active screening operations in the reported period.
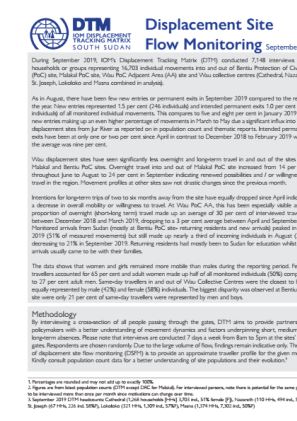
South Sudan — Displacement Site Flow Monitoring (September 2019)
During September 2019, IOM’s Displacement Tracking Matrix (DTM) conducted 7,148 interviews with households or groups representing 16,703 individual movements into and out of Bentiu Protection of Civilians (PoC) site, Malakal PoC site, Wau PoC Adjacent Area (AA) site and Wau collective centres
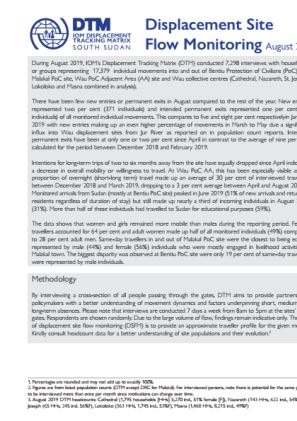
South Sudan — Displacement Site Flow Monitoring (August 2019)
During August 2019, IOM’s Displacement Tracking Matrix (DTM) conducted 7,298 interviews with households or groups representing 17,379 individual movements into and out of Bentiu Protection of Civilians (PoC) site, Malakal PoC site, Wau PoC Adjacent Area (AA) site and Wau collective
Ethiopia - Flow Monitoring Dashboard 1 (September 2019)
In September 2019, a total of 10,208 movements were observed across Ethiopia's Five Flow Monitoring Points. This represents a 6% decrease in comparison with August 2019 when 10,858 movements were observed.
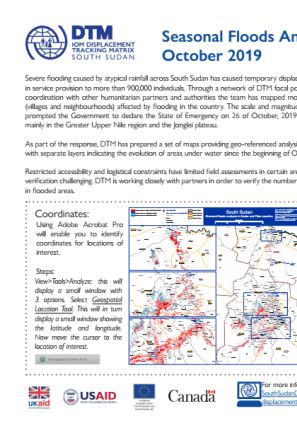
South Sudan — Seasonal Flooding Maps (November 2019)
Severe flooding caused by atypical rainfall across South Sudan has caused temporary displacement and disruption in service provision to more than 900,000 individuals.
Burundi - Cartographie de la mobilité des populations (Septembre 2019)
Ce Tableau de Bord offre une analyse des tendances de mobilité des populations observées au niveau de trois (3) points de suivi des flux établis à la frontière entre le Burundi et la République Démocratique du Congo (RDC) à Gatumba, Vugizo et Kagwema.
South Sudan — Disability & Inclusion Survey Wau PoC AA (2019)
The International Organization for Migration’s Displacement Tracking Matrix (IOM DTM) and Humanity & Inclusion (HI) joined efforts to undertake an assessment of the level of access to services and the barriers faced by persons with disabilities within Wau Protection of Civilian Adjacent Area
Oct 31 2019
South Sudan — Disability & Inclusion Survey Wa…
Burundi - Population Mobility Mapping (September 2019)
This Dashboard provides an analysis of the trends in population mobility observed at three (3) flow monitoring points established between the Burundi and Democratic Republic of Congo (DRC) border at Gatumba, Vugizo, and Kagwema. Observations were made between the 2nd and 30th of September 2019.
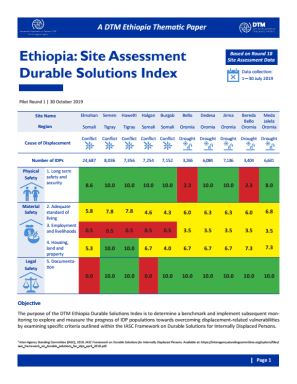
Ethiopia — Thematic Paper: Site Assessment Durable Solutions Index Report 1
The DTM Ethiopia Site Assessment Durable Solutions Index Report measures the progress of IDP populations towards overcoming displacement-related vulnerabilities by examining specific criteria outlined within the IASC Framework on Durable Solutions for Internally Displaced Persons.
BURUNDI — Population Mobility Mapping (August 2019)
This Dashboard provides an analysis of the trends in population mobility observed at three (3) flow monitoring points established between the Burundi and Democratic Republic of Congo (DRC) border at Gatumba, Vugizo, and Kagwema. Observations were made between the 1st and 31st of August 2019.
BURUNDI — Cartographie de la mobilité des populations (Août 2019)
Ce Tableau de Bord offre une analyse des tendances de mobilité des populations observées au niveau de trois (3) points de suivi des flux établis à la frontière entre le Burundi et la République Démocratique du Congo (RDC) à Gatumba, Vugizo et Kagwema.
Burundi — Suivi des urgences (20-26 Octobre 2019)
Ce suivi des urgences a été realisé au Burundi pendant la semaine du 20 au 26 Octobre 2019. DTM a identifié 330 personnes affectées, dont 236 personnes déplacées.
Djibouti — Rapport Sur Les Points De Suivi Des Flux (Août 2019)
Au cours du mois d’août, le nombre moyen d’individus observés par jour a été de 674, ce qui correspond à une diminution de 24% par rapport aux 883 individus observés en moyenne quotidiennement au mois précédent.
Mozambique — Cyclone IDAI Response - Situation Report — Round 10 (October 2019)
From 09 October to 16 October, in close coordination with Mozambique’s National Institute for Disaster Management (INGC), IOM’s Displacement Tracking Matrix (DTM) teams conducted multi-sectoral location assessments (MSLA) at resettlement sites in the four affected Provinces.
Burundi — Displacement Dashboard (September 2019)
The DTM Burundi dashboard for the month of September 2019 covered all 18 provinces of Burundi. The DTM has identified 103,412 internally displaced persons (IDPs) and 23,180 households in the month of September.
Pagination
Para obtener resultados de búsqueda más avanzados, vaya a la Página de búsqueda avanzada de conjuntos de datos
Pagination
- First page
- Previous page
- …
- 21
- 22
- 23
- 24
- 25
- 26
- 27
- 28
- 29
Pagination
- First page
- Previous page
- …
- 17
- 18
- 19
- 20
- 21
- 22
- 23
- 24
- 25


