-
Countries
-
Data and Analysis
-
Special Focus
-
Crisis Responses
Ethiopia - Countrywide Monitoring
Feb 15 2017
Print
Países en esta respuesta
- Active DTM operation
- Past DTM operation
Check out the interactive dashboard
Ethiopia - Site Assessment Dashboard
Para obtener resultados de búsqueda más avanzados, vaya a la Página de búsqueda avanzada de informes
Ethiopia — Flow Monitoring Dashboard 31 (April 2022)
In April 2022, a total of 26,668 movements were observed across five of Ethiopia's flow monitoring points (FMPs). This represents a 25% increase in daily average movements in comparison with March 2022 when an average of 711 movements per day were observed.
Ethiopia — Flow Monitoring Dashboard 30 (March 2022)
In March 2022, a total of 22,029 movements were observed across five of Ethiopia's flow monitoring points (FMPs). This represents a 6% increase in daily average movements in comparison with February 2022 when an average of 667 movements per day were observed.
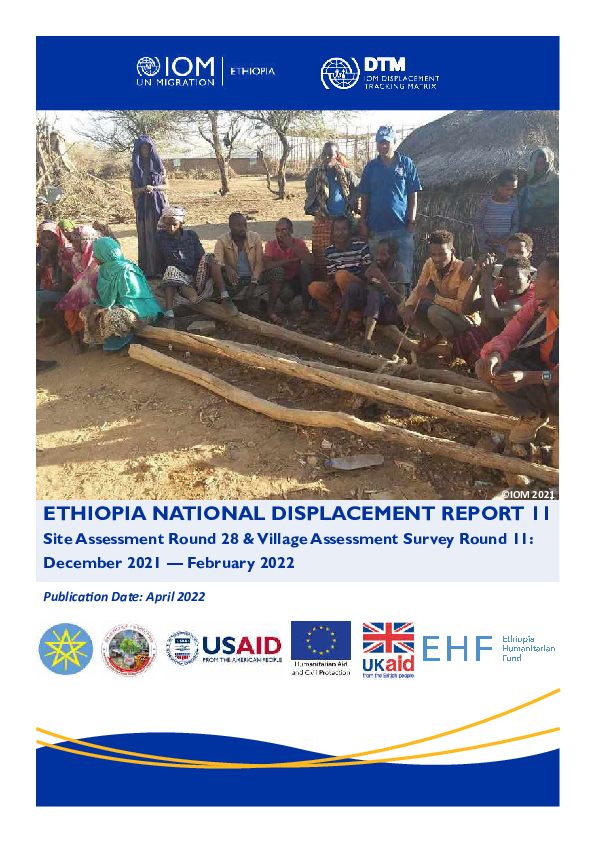
Ethiopia — National Displacement Report 11 (December 2021 — February 2022)
In order to capture the displacement and return dynamics in Ethiopia, DTM Ethiopia's National Displacement Report combines findings from its Site Assessment (SA) in Section 1 and findings from the Village Assessment Survey (VAS) in Section 2.
Ethiopia — Flow Monitoring Dashboard 29 (February 2022)
In February 2022, a total of 18,683 movements were observed across five of Ethiopia's flow monitoring points (FMPs).
Ethiopia — Mobility Overview 2021
The Mobility Overview 2021 report details significant movements within the country and a national overview of displacement and returns, which mainly draws from DTM’s Site Assessment, Emergency Site Assessment, Village Assessment Survey and an extensive national network of key informan
Mar 02 2022
Ethiopia — Mobility Overview 2021
Ethiopia — Flow Monitoring Dashboard 27 (December 2021)
In December 2021, a total of 18,049 movements were observed across five of Ethiopia's flow monitoring points (FMPs).
Ethiopia — Flow Monitoring Dashboard 26 (November 2021)
In November 2021, a total of 16,619 movements were observed across five of Ethiopia's flow monitoring points (FMPs).
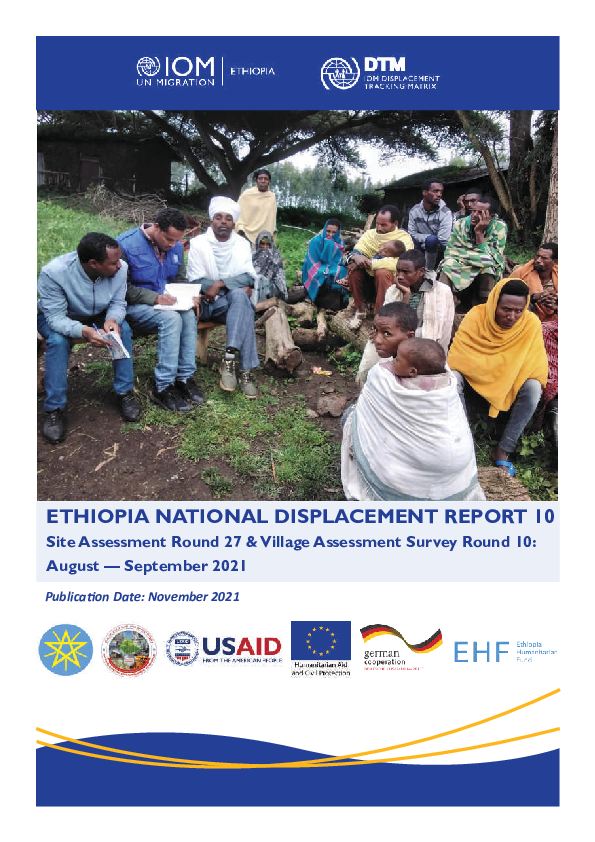
Ethiopia — National Displacement Report 10 (August - September 2021)
In order to capture the displacement and return dynamics in Ethiopia, DTM Ethiopia's National Displacement Report combines findings from its Site Assessment (SA) in Section 1 and findings from the Village Assessment Survey (VAS) in Section 2.
Ethiopia — Emergency Site Assessment 8 (27 July - 4 October 2021)
From 27 July— 4 October 2021, the Displacement Tracking Matrix (DTM) deployed its Emergency Site Assessment (ESA) to capture internal displacement related to the Northern Ethiopia Crisis.
Ethiopia — Flow Monitoring Dashboard 25 (October 2021)
In October 2021, a total of 14,227 movements were observed across four of Ethiopia's flow monitoring points (FMPs).
Ethiopia — Flow Monitoring Dashboard 24 (September 2021)
In September 2021, a total of 20,910 movements were observed across five of Ethiopia's flow monitoring points (FMPs).
Ethiopia — Flow Monitoring Dashboard 23 (August 2021)
In August 2021, a total of 23,724 movements were observed across five of Ethiopia's flow monitoring points (FMPs).
Pagination
Para obtener resultados de búsqueda más avanzados, vaya a la Página de búsqueda avanzada de conjuntos de datos


