Jan 31 2024
- Survey
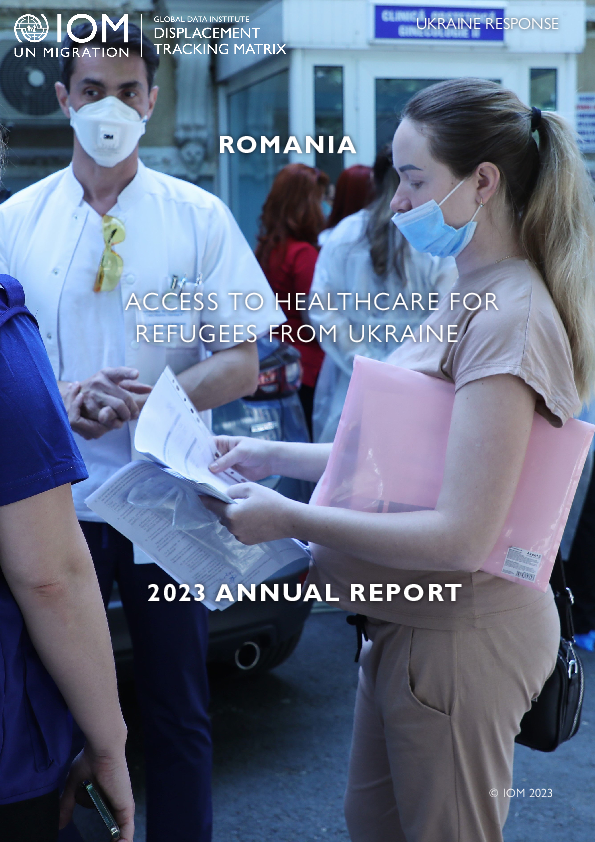
Key findings:
- Specific needs* include chronic diseases or serious medical conditions (60%), visual impairment (18%), mobility impairment (8%) and pregnant or lactating women (8%).
- Priority needs include medicine (32%) and healthcare services (67%).
- More male respondents reported needing medicine (35%) than their female counterparts (31%)
- Female respondents required healthcare services (69%) more than men (65%).
- Groups with elderly required medicine (40%) more than healthcare services (30%).
- Groups with children needed healthcare services (56%) more than medicine (46%),
Dec 31 2023
- Survey
Key Findings:
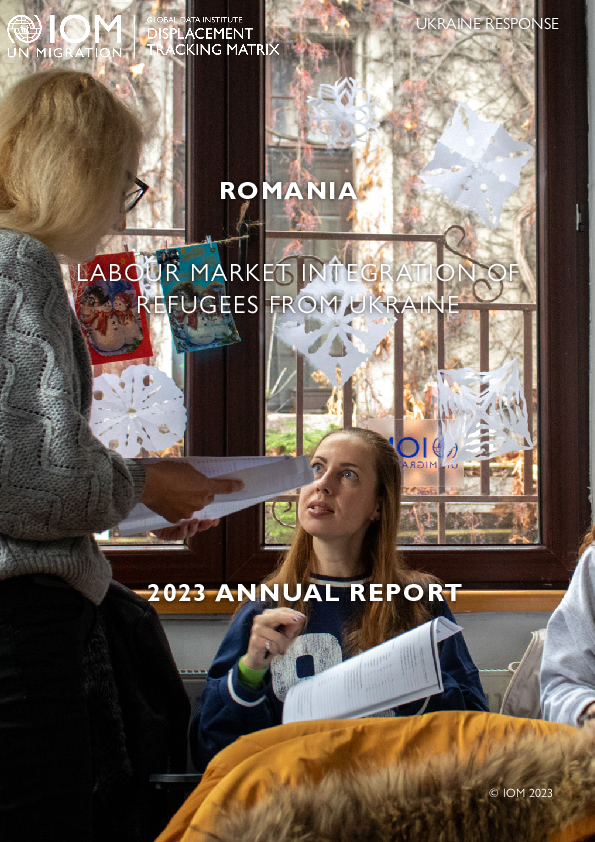
- Among respondents, 43 per cent are active (employed or unemployed), and 46 per cent are inactive (student status, parental leave, retirement, unemployment and not looking for a job).
- Within active population, 54 per cent are employed and 46 are unemployed.
- 90 per cent of respondents do not speak Romanian
- Top barriers to employment include: language barrier (55%), where to find jobs (40%) and lack of jobs suited to qualifications (40%)5
- Top reasons for unemployment and not looking for a job: parental leave (39%), helping family (15%), retired (15%) and no need to work (14%)
- Top occupations: services and sales (28%), plants and machinery operations (21%), education (16%), administrative fields (9%)
- Mobility Tracking
- Site Assessment
- Village Assessment
Dec 07 2020
Population Groups
IDPs
Other
Returnee (Previously Internally Displaced)
Survey Methodology
Unit of Analysis Or Observation
Site or Location
Type of Survey or Assessment
Household
Keywords
Geographical Scope Partial Coverage
Administrative boundaries with available data
The current dataset covers the following administrative boundaries
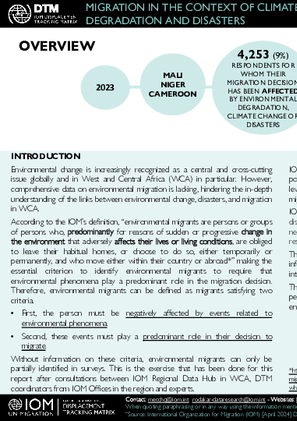
Environmental change is increasingly recognized as a central and cross-cutting issue globally and in West and Central Africa (WCA) in particular. However, comprehensive data on environmental migration is lacking, hindering the in-depth understanding of the links between environmental change, disasters, and migration in WCA.
According to the IOM’s definition, “environmental migrants are persons or groups of persons who, predominantly for reasons of sudden or progressive change in the environment that adversely affects their lives or living conditions, are obliged to leave their habitual homes, or choose to do so, either temporarily or permanently, and who move either within their country or abroad” making the essential criterion to identify environmental migrants to require that environmental phenomena play a predominant role in the migration decision.
This first dashboard aims at providing detailed information and evidence on people on the move in the context of disasters, climate change, and environmental degradation.
- Mobility Tracking
Aug 29 2023
The round 4 data collection was conducted between August 18 and August 29, 2023, among 5,801 households in the six departments (Diamaré, Logone-Et-Chari, Mayo-Danay, Mayo-Kani, Mayo Sava, and Mayo-Tsanaga) of the Extreme North region. This was done using a questionnaire developed by IOM, OCHA, and various sectors. An overview of the needs was obtained following joint data analysis with the lead representatives from each sector.
Population Groups
IDPs
Other
Returnee (Previously Displaced Abroad)
Returnee (Previously Internally Displaced)
Survey Methodology
Unit of Analysis Or Observation
Site or Location
Type of Survey or Assessment
Household
Keywords
Geographical Scope Partial Coverage
Administrative boundaries with available data
The current dataset covers the following administrative boundaries
- Other
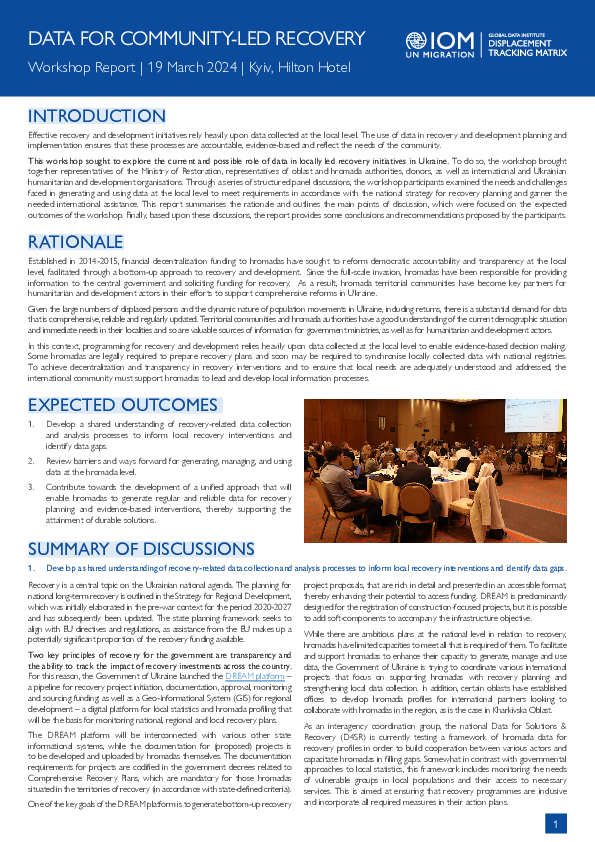
Effective recovery and development initiatives rely heavily upon data collected at the local level. The use of data in recovery and development planning and implementation ensures that these processes are accountable, evidence-based and reflect the needs of the community.
This workshop sought to explore the current and possible role of data in locally led recovery initiatives in Ukraine. To do so, the workshop brought together representatives of the Ministry of Restoration, representatives of oblast and hromada authorities, donors, as well as international and Ukrainian humanitarian and development organisations. Through a series of structured panel discussions, the workshop participants examined the needs and challenges faced in generating and using data at the local level to meet requirements in accordance with the national strategy for recovery planning and garner the needed international assistance.
This report summarises the rationale and outlines the main points of discussion, which were focused on the expected outcomes of the workshop. Finally, based upon these discussions, the report provides some conclusions and recommendations proposed by the participants.
- Mobility Tracking
- Baseline Assessment
Aug 29 2023
Data collection for round 27 was conducted from 18 to 29 August 2023 through 3,715 key informants, accross 1,283 localities. During this round, 700,766 internally displaced individuals were identified, including 453,661 IDPs, 198,940 Returnees, and 48,165 Out-of-camp refugees
Population Groups
IDPs
Migrants Present
Returnee (Previously Displaced Abroad)
Returnee (Previously Internally Displaced)
Survey Methodology
Unit of Analysis Or Observation
Admin Area 4
Type of Survey or Assessment
Key Informant
Keywords
Geographical Scope Partial Coverage
Administrative boundaries with available data
The current dataset covers the following administrative boundaries
- Mobility Tracking
- Baseline Assessment
Mar 31 2024
The data collected for the Area Baseline Assessment Round 34 reflects the up-to-date local administrative register of the IDP population as of 31 March 2024, equivalent to a total of 3,387,291 registered IDPs. Registered IDP figures were collected for 1,098 hromadas (83% of all hromadas covered in Ukrainian government-controlled areas), across 108 raions and 23 oblasts.
A more detailed version of this dataset at the Hromada level is available. To get access, kindly click on the 'Request Access' button.
Population Groups
IDPs
Survey Methodology
Unit of Analysis Or Observation
Admin Area 2
Type of Survey or Assessment
Key Informant
Keywords
Geographical Scope Partial Coverage
Administrative boundaries with available data
The current dataset covers the following administrative boundaries
Dec 31 2023
- Flow Monitoring
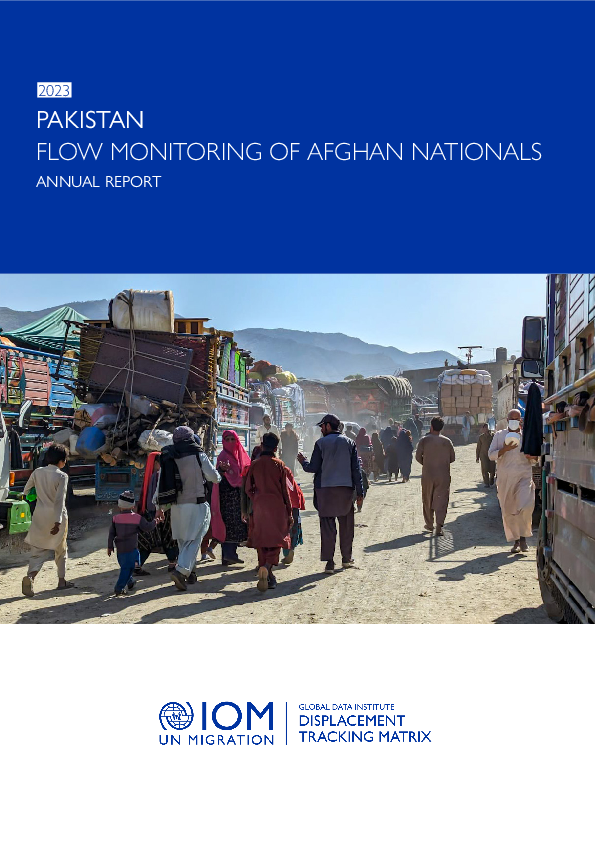
This report presents a comprehensive analysis of the movement trends involving Afghan returnees from Pakistan. The assessment was conducted from January to December 2023 and employs the Displacement Tracking Matrix (DTM) methodology across several Border Crossing Points (BCPs) to analyse movement trends of Afghan returnees from Pakistan. IOM collected data from 23,860 household heads, representing 558,212 Afghan nationals.
The report highlights the significant increase in the number of returnees following the enactment of Pakistan's "Illegal Foreigners’ Repatriation Plan (IFRP)," which led to a marked spike in movements during the fourth quarter of 2023. It also details the demographics and vulnerabilities of the returnees, showing that a substantial number are undocumented or hold invalid documentation.
Additionally, the report examines the socio-economic impacts on the returnees, such as changes in their source of income and types of residence before and after their return. It further notes the challenges returnees anticipate in Afghanistan, including finding employment, securing shelter, and reintegrating into society.
- Flow Monitoring
- Mobility Tracking
- Baseline Assessment
Mar 31 2024
In March 2024, IOM Yemen DTM recorded 1,930 migrants entering Yemen, an increase of 11 per cent compared to last month (1,744). Shabwah typically serves as an entry point for migrants departing from Somalia and rarely sees migrants departing from Djibouti due to the considerable distance between Djibouti and Shabwah. Thus, Shabwah was the arrival destination for 93 per cent of migrants departed from Bari, Somalia (1,800). The overall number of migrants entering through Shabwah has increased by three per cent in March (1,800) compared to February 2024 (1,744). Moreover, the team in Abyan governorate recorded new migrants landing in Ahwar district - Hesn Balead FMP. The number of migrants arriving through Abyan coast reached to 130 (all departed from Somalia).
According to DTM, conflict-induced movements constituted 57 per cent of all incoming movements in March 2024. These movements were exclusively observed in Shabwah, originating from Bari, Somalia (21% children, 23% women, and 56% men).
DTM observed an increase in Yemeni returnees by 36 per cent in March (4,226) compared to February (3,116). Furthermore, in March 2024, a total of 411 migrants ( 385 Ethiopian, 25 Yemeni, and one Somali) were deported from Oman back to Hawf district of Al Maharah governorate, Yemen.
The deteriorating humanitarian crisis in Yemen has forced many migrants to make the difficult decision to return to their home countries in the Horn of Africa. Others are reported to have been deported by authorities. DTM recorded that in March 2024, a total of 1,174 migrants either opted to take the risky journey back or were deported by boat from Yemen. This group consisted of 91 per cent men, seven per cent women, and two per cent children.
Additionally, the Djibouti DTM team documented that during the same period, a total of 1,177 migrants (92 per cent men, four per cent women, and four per cent children) embarked on a dangerous journey back home by boat from Yemen. These numbers highlight the significant challenges faced by migrants in Yemen and the desperate situations that have driven them to undertake perilous voyages across the sea.
Population Groups
Survey Methodology
Unit of Analysis Or Observation
Type of Survey or Assessment
Keywords
Geographical Scope
Administrative boundaries with available data
The current dataset covers the following administrative boundaries